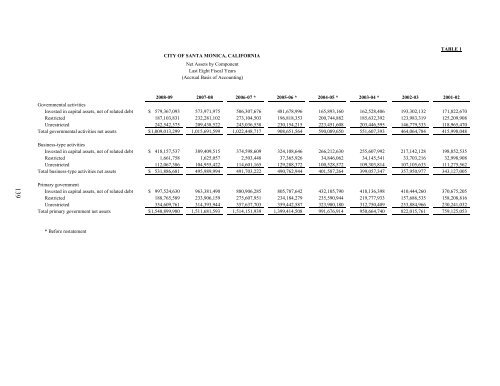
CITY OF SANTA MONICA, CALIFORNIA Net Assets by Component Last Eight Fiscal Years (Accrual Basis <strong>of</strong> Accounting) TABLE 1 2008-09 2007-08 2006-07 * 2005-06 * 2004-05 * 2003-04 * 2002-03 2001-02 Governmental activities Invested in capital assets, net <strong>of</strong> related debt $ 579,367,093 573,971,975 506,307,676 481,678,996 165,893,160 162,528,406 193,302,132 171,822,670 Restricted 187,103,831 232,281,102 273,104,503 196,818,353 200,744,882 185,632,392 123,983,319 125,209,908 Unrestricted 242,542,375 209,438,522 243,036,538 230,154,215 223,451,608 203,446,595 146,779,333 118,965,470 Total governmental activities net assets $ 1,009,013,299 1,015,691,599 1,022,448,717 908,651,564 590,089,650 551,607,393 464,064,784 415,998,048 Business-type activities Invested in capital assets, net <strong>of</strong> related debt $ 418,157,537 389,409,515 374,598,609 324,108,646 266,212,630 255,607,992 217,142,128 198,852,535 Restricted 1,661,758 1,625,057 2,503,448 37,365,926 34,846,062 34,145,541 33,703,216 32,998,908 Unrestricted 112,067,386 104,955,422 114,601,165 129,288,372 100,528,572 109,303,814 107,105,633 111,275,562 Total business-type activities net assets $ 531,886,681 495,989,994 491,703,222 490,762,944 401,587,264 399,057,347 357,950,977 343,127,005 139 Primary government Invested in capital assets, net <strong>of</strong> related debt $ 997,524,630 963,381,490 880,906,285 805,787,642 432,105,790 418,136,398 410,444,260 370,675,205 Restricted 188,765,589 233,906,159 275,607,951 234,184,279 235,590,944 219,777,933 157,686,535 158,208,816 Unrestricted 354,609,761 314,393,944 357,637,703 359,442,587 323,980,180 312,750,409 253,884,966 230,241,032 Total primary government net assets $ 1,540,899,980 1,511,681,593 1,514,151,939 1,399,414,508 991,676,914 950,664,740 822,015,761 759,125,053 * Before restatement
CITY OF SANTA MONICA, CALIFORNIA Changes in Net Assets Last Eight Fiscal Years TABLE 2 2008-2009 2007-08 2006-07 2005-06 2004-05 2003-04 2002-03 2001-02 Expenses Governmental activities: General government $ 46,670,826 38,849,626 45,323,227 31,288,910 33,648,946 12,218,726 22,203,518 21,322,302 Public safety 100,709,990 91,862,403 87,830,433 82,886,707 80,300,625 74,489,887 63,496,266 59,229,995 General services 161,224,085 111,168,586 41,404,237 64,777,602 32,961,058 30,659,648 37,843,832 36,040,609 Cultural and recreation services 44,031,895 33,776,210 43,646,843 40,022,151 35,163,220 36,958,290 33,896,585 31,594,286 Library 11,422,789 11,458,259 10,681,518 7,974,534 7,849,658 20,241,923 6,331,445 6,348,239 Housing and community development 115,827,555 91,966,369 74,988,387 56,708,298 52,223,052 64,079,218 40,512,087 45,432,842 Other (1) — — 469,285 2,212,186 1,273,607 244,438 422,786 557,009 Interest on long term debt 7,252,197 7,628,437 7,934,428 7,514,924 9,507,522 8,430,126 7,719,369 6,172,349 Total governmental activities 487,139,337 386,709,890 312,278,358 293,385,312 252,927,688 247,322,256 212,425,888 206,697,631 140 Business-type activities: Water 15,958,328 15,489,230 14,830,595 13,855,863 17,564,916 16,382,688 13,636,722 13,831,274 Solid waste management 19,219,079 16,277,710 18,630,141 17,459,310 16,550,895 15,933,665 15,022,708 14,666,038 Pier 5,200,065 4,867,415 9,485,709 7,544,001 6,922,305 8,079,003 6,108,337 6,078,956 Wastewater 19,603,411 20,063,420 19,579,035 19,008,944 14,755,836 14,013,170 15,652,716 13,056,831 Civic auditorium 3,933,159 3,718,652 3,535,624 2,898,853 3,129,521 2,741,857 2,839,311 2,932,981 Airport 5,737,927 5,199,701 5,325,190 3,882,639 3,845,108 3,845,116 3,675,501 3,922,749 Storm water management 721,728 474,683 502,183 648,374 966,897 403,294 374,866 365,634 Cemetery 1,956,609 1,715,605 1,481,238 989,274 1,243,343 1,137,698 1,066,434 1,140,900 Big Blue Bus 70,855,809 65,185,007 59,627,736 59,180,481 52,021,645 47,265,202 44,543,108 39,979,131 Cable communications (2) — — — — 1,340,120 932,823 883,657 875,316 Special aviation 28,904 18,333 69,374 52,329 52,329 52,329 52,329 52,329 Parking authority 1,598,765 349,576 709,982 16,189 202,794 337,552 558,058 545,352 Total business-type activities 144,813,784 133,359,332 133,776,807 125,536,257 118,595,709 111,124,397 104,413,747 97,447,491 Total primary governmental activities expenses 631,953,121 520,069,222 446,055,165 418,921,569 371,523,397 358,446,653 316,839,635 304,145,122 Program revenues Governmental activities: Charges for services: General government 19,198,345 17,188,876 17,326,675 12,567,222 10,854,382 7,005,002 6,576,292 5,448,469 Public safety 17,064,322 17,298,741 17,202,256 15,754,085 15,840,756 15,671,730 12,463,506 10,658,978 General services 20,291,439 19,650,237 18,841,288 17,880,336 15,776,086 15,105,283 11,130,386 1,418,980 Cultural and recreation services 10,608,948 9,492,174 9,002,084 8,556,557 8,147,054 (3) 7,842,184 6,763,867 6,151,835 Library 410,908 363,987 349,139 232,025 173,864 178,555 276,812 298,581 Housing and community development 12,416,654 14,430,326 13,925,980 12,553,269 12,193,457 13,478,114 8,647,389 3,753,717 Operating grants and contributions 30,164,300 34,803,655 28,362,525 25,133,124 26,063,799 31,705,184 28,720,949 13,917,213 Capital grants and contributions 20,379,864 4,862,387 4,839,925 5,838,885 612,985 1,500,466 17,365,486 14,549,774 Total governmental activities program revenues 130,534,780 118,090,383 109,849,872 98,515,503 89,662,383 92,486,518 91,944,687 56,197,547 (continues next page)
- Page 1:
Comprehensive Annual Financial Repo
- Page 5 and 6:
CITY OF SANTA MONICA, CALIFORNIA Co
- Page 7:
THIS PAGE INTENTIONALLY LEFT BLANK.
- Page 10 and 11:
amount of borrowed property taxes i
- Page 12 and 13:
five-year forecasts, and an underst
- Page 14 and 15:
Cash Management Policies and Practi
- Page 16 and 17:
OFFICIALS OF THE CITY OF SANTA MONI
- Page 18 and 19:
Certificate of Achievement for Exce
- Page 23 and 24:
CITY OF SANTA MONICA, CALIFORNIA Ma
- Page 25 and 26:
CITY OF SANTA MONICA, CALIFORNIA Ma
- Page 27 and 28:
CITY OF SANTA MONICA, CALIFORNIA Ma
- Page 29 and 30:
CITY OF SANTA MONICA, CALIFORNIA Ma
- Page 31 and 32:
CITY OF SANTA MONICA, CALIFORNIA Ma
- Page 33 and 34:
CITY OF SANTA MONICA, CALIFORNIA Ma
- Page 36 and 37:
CITY OF SANTA MONICA, CALIFORNIA St
- Page 38 and 39:
CITY OF SANTA MONICA, CALIFORNIA Ma
- Page 40 and 41:
CITY OF SANTA MONICA, CALIFORNIA St
- Page 42 and 43:
CITY OF SANTA MONICA, CALIFORNIA St
- Page 44 and 45:
CITY OF SANTA MONICA, CALIFORNIA St
- Page 46 and 47:
CITY OF SANTA MONICA, CALIFORNIA St
- Page 48 and 49:
CITY OF SANTA MONICA, CALIFORNIA Pr
- Page 50 and 51:
CITY OF SANTA MONICA, CALIFORNIA St
- Page 52 and 53:
CITY OF SANTA MONICA, CALIFORNIA St
- Page 54 and 55:
CITY OF SANTA MONICA, CALIFORNIA Fi
- Page 56 and 57:
CITY OF SANTA MONICA, CALIFORNIA No
- Page 58 and 59:
CITY OF SANTA MONICA, CALIFORNIA No
- Page 60 and 61:
CITY OF SANTA MONICA, CALIFORNIA No
- Page 62 and 63:
CITY OF SANTA MONICA, CALIFORNIA No
- Page 64 and 65:
CITY OF SANTA MONICA, CALIFORNIA No
- Page 66 and 67:
CITY OF SANTA MONICA, CALIFORNIA No
- Page 68 and 69:
CITY OF SANTA MONICA, CALIFORNIA No
- Page 70 and 71:
CITY OF SANTA MONICA, CALIFORNIA No
- Page 72 and 73:
CITY OF SANTA MONICA, CALIFORNIA No
- Page 74 and 75:
CITY OF SANTA MONICA, CALIFORNIA No
- Page 76 and 77:
CITY OF SANTA MONICA, CALIFORNIA No
- Page 78 and 79:
CITY OF SANTA MONICA, CALIFORNIA No
- Page 80 and 81:
CITY OF SANTA MONICA, CALIFORNIA No
- Page 82 and 83:
CITY OF SANTA MONICA, CALIFORNIA No
- Page 84 and 85:
CITY OF SANTA MONICA, CALIFORNIA No
- Page 86 and 87:
CITY OF SANTA MONICA, CALIFORNIA No
- Page 88 and 89:
CITY OF SANTA MONICA, CALIFORNIA No
- Page 90 and 91:
CITY OF SANTA MONICA, CALIFORNIA No
- Page 92 and 93:
CITY OF SANTA MONICA, CALIFORNIA No
- Page 94 and 95:
CITY OF SANTA MONICA, CALIFORNIA No
- Page 96 and 97:
CITY OF SANTA MONICA, CALIFORNIA No
- Page 98 and 99:
CITY OF SANTA MONICA, CALIFORNIA No
- Page 100 and 101:
CITY OF SANTA MONICA, CALIFORNIA No
- Page 102 and 103:
CITY OF SANTA MONICA, CALIFORNIA No
- Page 104 and 105:
CITY OF SANTA MONICA, CALIFORNIA No
- Page 106 and 107:
CITY OF SANTA MONICA, CALIFORNIA No
- Page 108 and 109:
CITY OF SANTA MONICA, CALIFORNIA No
- Page 110 and 111:
City of Santa Monica, California Ye
- Page 112 and 113: CITY OF SANTA MONICA, CALIFORNIA Ca
- Page 114 and 115: CITY OF SANTA MONICA, CALIFORNIA Co
- Page 116 and 117: CITY OF SANTA MONICA, CALIFORNIA Co
- Page 118 and 119: CITY OF SANTA MONICA, CALIFORNIA Co
- Page 120 and 121: CITY OF SANTA MONICA, CALIFORNIA Sc
- Page 122 and 123: CITY OF SANTA MONICA, CALIFORNIA Sc
- Page 124 and 125: CITY OF SANTA MONICA, CALIFORNIA Sc
- Page 126 and 127: CITY OF SANTA MONICA, CALIFORNIA Sc
- Page 128 and 129: CITY OF SANTA MONICA, CALIFORNIA Sc
- Page 130 and 131: CITY OF SANTA MONICA, CALIFORNIA Sc
- Page 132 and 133: CITY OF SANTA MONICA, CALIFORNIA Co
- Page 134 and 135: CITY OF SANTA MONICA, CALIFORNIA Sc
- Page 136 and 137: CITY OF SANTA MONICA, CALIFORNIA Sc
- Page 138 and 139: CITY OF SANTA MONICA, CALIFORNIA Sc
- Page 140 and 141: CITY OF SANTA MONICA, CALIFORNIA Co
- Page 142 and 143: CITY OF SANTA MONICA, CALIFORNIA Co
- Page 144 and 145: THIS PAGE INTENTIONALLY LEFT BLANK
- Page 146 and 147: CITY OF SANTA MONICA, CALIFORNIA St
- Page 148 and 149: CITY OF SANTA MONICA, CALIFORNIA St
- Page 150 and 151: CITY OF SANTA MONICA, CALIFORNIA St
- Page 152 and 153: CITY OF SANTA MONICA, CALIFORNIA St
- Page 154 and 155: CITY OF SANTA MONICA, CALIFORNIA St
- Page 156 and 157: CITY OF SANTA MONICA, CALIFORNIA Co
- Page 158: THIS PAGE INTENTIONALLY LEFT BLANK
- Page 161: CITY OF SANTA MONICA, CALIFORNIA Fo
- Page 165 and 166: CITY OF SANTA MONICA, CALIFORNIA Ch
- Page 167 and 168: CITY OF SANTA MONICA, CALIFORNIA Ch
- Page 169 and 170: CITY OF SANTA MONICA, CALIFORNIA Ge
- Page 171 and 172: CITY OF SANTA MONICA, CALIFORNIA Di
- Page 173 and 174: CITY OF SANTA MONICA, CALIFORNIA Pr
- Page 175 and 176: CITY OF SANTA MONICA, CALIFORNIA Ra
- Page 177 and 178: CITY OF SANTA MONICA, CALIFORNIA Di
- Page 179 and 180: CITY OF SANTA MONICA, CALIFORNIA Wa
- Page 181 and 182: CITY OF SANTA MONICA, CALIFORNIA Re
- Page 183 and 184: CITY OF SANTA MONICA, CALIFORNIA Pr
- Page 185 and 186: CITY OF SANTA MONICA, CALIFORNIA Op
- Page 187: THIS PAGE INTENTIONALLY LEFT BLANK