

Comprehensive Annual Financial Report - City of Santa Monica
Comprehensive Annual Financial Report - City of Santa Monica
Comprehensive Annual Financial Report - City of Santa Monica

You also want an ePaper? Increase the reach of your titles
YUMPU automatically turns print PDFs into web optimized ePapers that Google loves.
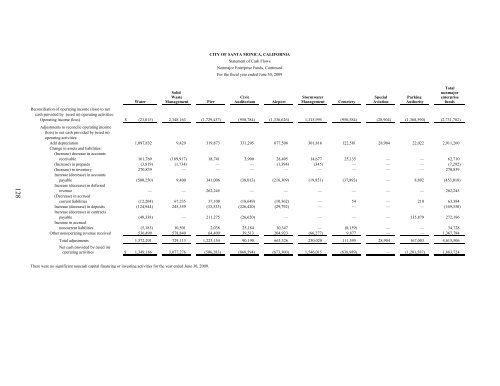
CITY OF SANTA MONICA, CALIFORNIA<br />
Statement <strong>of</strong> Cash Flows<br />
Nonmajor Enterprise Funds, Continued<br />
For the fiscal year ended June 30, 2009<br />
128<br />
Total<br />
Solid<br />
nonmajor<br />
Waste Civic Stormwater Special Parking enterprise<br />
Water Management Pier Auditorium Airport Management Cemetery Aviation Authority funds<br />
Reconciliation <strong>of</strong> operating income (loss) to net<br />
cash provided by (used in) operating activities:<br />
Operating income (loss) $ (23,015) 2,348,163 (1,729,437) (958,784) (1,336,626) 1,315,995 (950,584) (28,904) (1,368,590) (2,731,782)<br />
Adjustments to reconcile operating income<br />
(loss) to net cash provided by (used in)<br />
operating activities:<br />
Add depreciation 1,097,832 9,429 319,873 331,295 677,508 301,816 122,581 28,904 22,022 2,911,260<br />
Change in assets and liabilities:<br />
(Increase) decrease in accounts<br />
receivable 161,769 (189,917) 18,741 3,900 28,405 14,677 25,135 — — 62,710<br />
(Increase) in prepaids (3,819) (1,734) — — (1,394) (345) — — — (7,292)<br />
(Increase) in inventory 270,839 — — — — — — — — 270,839<br />
Increase (decrease) in accounts<br />
payable (500,250) 9,400 341,006 (38,013) (216,309) (19,851) (37,893) — 8,892 (453,018)<br />
Increase (decrease) in deferred<br />
revenue — — 262,245 — — — — — — 262,245<br />
(Decrease) in accrued<br />
current liabilities (12,204) 67,235 37,100 (18,649) (10,362) — 54 — 210 63,384<br />
Increase (decrease) in deposits (124,944) 245,359 (33,533) (226,420) (29,792) — — — — (169,330)<br />
Increase (decrease) in contracts<br />
payable (48,338) — 211,275 (26,620) — — — — 135,879 272,196<br />
Increase in accrued<br />
noncurrent liabilities (5,183) 10,501 2,038 25,184 10,347 — (8,159) — — 34,728<br />
Other nonoperating revenue received 536,499 578,840 64,409 39,513 204,923 (66,277) 9,877 — — 1,367,784<br />
Total adjustments 1,372,201 729,113 1,223,154 90,190 663,326 230,020 111,595 28,904 167,003 4,615,506<br />
Net cash provided by (used in)<br />
operating activities $ 1,349,186 3,077,276 (506,283) (868,594) (673,300) 1,546,015 (838,989) — (1,201,587) 1,883,724<br />
There were no significant noncash capital financing or investing activities for the year ended June 30, 2009.


