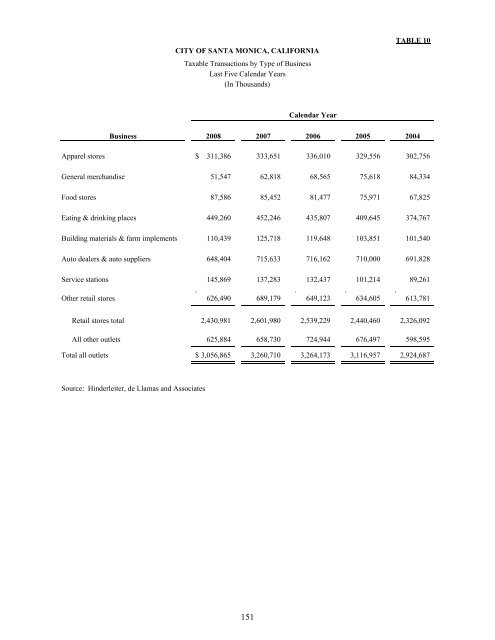
CITY OF SANTA MONICA, CALIFORNIA Taxable Transactions by Type <strong>of</strong> Business Last Five Calendar Years (In Thousands) TABLE 10 Calendar Year Business 2008 2007 2006 2005 2004 Apparel stores $ 311,386 333,651 336,010 329,556 302,756 General merchandise 51,547 62,818 68,565 75,618 84,334 Food stores 87,586 85,452 81,477 75,971 67,825 Eating & drinking places 449,260 452,246 435,807 409,645 374,767 Building materials & farm implements 110,439 125,718 119,648 103,851 101,540 Auto dealers & auto suppliers 648,404 715,633 716,162 710,000 691,828 Service stations 145,869 137,283 132,437 101,214 89,261 . . . . Other retail stores 626,490 689,179 649,123 634,605 613,781 Retail stores total 2,430,981 2,601,980 2,539,229 2,440,460 2,326,092 All other outlets 625,884 658,730 724,944 676,497 598,595 Total all outlets $ 3,056,865 3,260,710 3,264,173 3,116,957 2,924,687 Source: Hinderleiter, de Llamas and Associates 151
CITY OF SANTA MONICA, CALIFORNIA Ratio <strong>of</strong> Outstanding Debt by Type Last Ten Fiscal Years TABLE 11 Fiscal year General obligation bonds Tax allocation bonds Governmental activities Lease revenue bonds Term loans payable (1) Line <strong>of</strong> Credit Wastewater bonds Business-type activities Certificates <strong>of</strong> participation Term loans payable Capital leases Total primary government Percentage <strong>of</strong> net assessed valuation (2) Per capita 2008-09 $ 18,455,000 $ 72,900,000 $ 67,880,000 $ 400,000 $ 15,485,324 $ 25,760,000 $ — $ 3,103,408 $ — $ 203,983,732 0.87% 2,205 2007-08 20,140,000 75,570,000 71,900,000 — — 27,260,000 — 3,363,238 — 198,233,238 0.94% 2,168 2006-07 21,800,000 78,115,000 75,770,000 — — 28,715,000 420,000 3,617,046 — 208,437,046 1.06% 2,287 2005-06 23,430,000 81,320,000 78,740,000 — — 29,975,000 820,000 3,864,987 — 218,149,987 1.21% 2,404 2004-05 25,035,000 78,025,000 81,610,000 — — 31,205,000 1,205,000 4,107,207 — 221,187,207 1.34% 2,439 2003-04 26,615,000 79,975,000 44,775,000 — — 32,335,000 1,570,000 4,343,865 — 189,613,865 1.21% 2,097 152 2002-03 28,170,000 81,840,000 46,235,000 — — 33,340,000 1,920,000 4,625,079 — 196,130,079 1.34% 2,195 2001-02 3,440,000 82,800,000 46,630,000 — — 34,230,000 2,255,000 4,900,995 30,718 174,286,713 1.29% 1,981 2000-01 3,690,000 73,975,000 31,650,000 — — 35,025,000 2,565,000 5,171,749 2,052,909 154,129,658 1.25% 1,801 1999-00 3,915,000 75,120,000 20,975,000 — — 35,725,000 2,865,000 5,555,507 — 144,155,507 1.27% 1,714 Note: (1) The State Department <strong>of</strong> Housing and Urban Development Deferred Payment Rehabilitation Loan Program (DPRLP) granted two $200,000 non-interest bearing loans to the <strong>City</strong>. (2) Net assessed property valuations have been used because personal income is not available. See Table 6 for net assessed valuations. Note: See Schedule <strong>of</strong> Demographic and Economic Statistics on Table 18 for population data.
- Page 1:
Comprehensive Annual Financial Repo
- Page 5 and 6:
CITY OF SANTA MONICA, CALIFORNIA Co
- Page 7:
THIS PAGE INTENTIONALLY LEFT BLANK.
- Page 10 and 11:
amount of borrowed property taxes i
- Page 12 and 13:
five-year forecasts, and an underst
- Page 14 and 15:
Cash Management Policies and Practi
- Page 16 and 17:
OFFICIALS OF THE CITY OF SANTA MONI
- Page 18 and 19:
Certificate of Achievement for Exce
- Page 23 and 24:
CITY OF SANTA MONICA, CALIFORNIA Ma
- Page 25 and 26:
CITY OF SANTA MONICA, CALIFORNIA Ma
- Page 27 and 28:
CITY OF SANTA MONICA, CALIFORNIA Ma
- Page 29 and 30:
CITY OF SANTA MONICA, CALIFORNIA Ma
- Page 31 and 32:
CITY OF SANTA MONICA, CALIFORNIA Ma
- Page 33 and 34:
CITY OF SANTA MONICA, CALIFORNIA Ma
- Page 36 and 37:
CITY OF SANTA MONICA, CALIFORNIA St
- Page 38 and 39:
CITY OF SANTA MONICA, CALIFORNIA Ma
- Page 40 and 41:
CITY OF SANTA MONICA, CALIFORNIA St
- Page 42 and 43:
CITY OF SANTA MONICA, CALIFORNIA St
- Page 44 and 45:
CITY OF SANTA MONICA, CALIFORNIA St
- Page 46 and 47:
CITY OF SANTA MONICA, CALIFORNIA St
- Page 48 and 49:
CITY OF SANTA MONICA, CALIFORNIA Pr
- Page 50 and 51:
CITY OF SANTA MONICA, CALIFORNIA St
- Page 52 and 53:
CITY OF SANTA MONICA, CALIFORNIA St
- Page 54 and 55:
CITY OF SANTA MONICA, CALIFORNIA Fi
- Page 56 and 57:
CITY OF SANTA MONICA, CALIFORNIA No
- Page 58 and 59:
CITY OF SANTA MONICA, CALIFORNIA No
- Page 60 and 61:
CITY OF SANTA MONICA, CALIFORNIA No
- Page 62 and 63:
CITY OF SANTA MONICA, CALIFORNIA No
- Page 64 and 65:
CITY OF SANTA MONICA, CALIFORNIA No
- Page 66 and 67:
CITY OF SANTA MONICA, CALIFORNIA No
- Page 68 and 69:
CITY OF SANTA MONICA, CALIFORNIA No
- Page 70 and 71:
CITY OF SANTA MONICA, CALIFORNIA No
- Page 72 and 73:
CITY OF SANTA MONICA, CALIFORNIA No
- Page 74 and 75:
CITY OF SANTA MONICA, CALIFORNIA No
- Page 76 and 77:
CITY OF SANTA MONICA, CALIFORNIA No
- Page 78 and 79:
CITY OF SANTA MONICA, CALIFORNIA No
- Page 80 and 81:
CITY OF SANTA MONICA, CALIFORNIA No
- Page 82 and 83:
CITY OF SANTA MONICA, CALIFORNIA No
- Page 84 and 85:
CITY OF SANTA MONICA, CALIFORNIA No
- Page 86 and 87:
CITY OF SANTA MONICA, CALIFORNIA No
- Page 88 and 89:
CITY OF SANTA MONICA, CALIFORNIA No
- Page 90 and 91:
CITY OF SANTA MONICA, CALIFORNIA No
- Page 92 and 93:
CITY OF SANTA MONICA, CALIFORNIA No
- Page 94 and 95:
CITY OF SANTA MONICA, CALIFORNIA No
- Page 96 and 97:
CITY OF SANTA MONICA, CALIFORNIA No
- Page 98 and 99:
CITY OF SANTA MONICA, CALIFORNIA No
- Page 100 and 101:
CITY OF SANTA MONICA, CALIFORNIA No
- Page 102 and 103:
CITY OF SANTA MONICA, CALIFORNIA No
- Page 104 and 105:
CITY OF SANTA MONICA, CALIFORNIA No
- Page 106 and 107:
CITY OF SANTA MONICA, CALIFORNIA No
- Page 108 and 109:
CITY OF SANTA MONICA, CALIFORNIA No
- Page 110 and 111:
City of Santa Monica, California Ye
- Page 112 and 113:
CITY OF SANTA MONICA, CALIFORNIA Ca
- Page 114 and 115:
CITY OF SANTA MONICA, CALIFORNIA Co
- Page 116 and 117:
CITY OF SANTA MONICA, CALIFORNIA Co
- Page 118 and 119:
CITY OF SANTA MONICA, CALIFORNIA Co
- Page 120 and 121:
CITY OF SANTA MONICA, CALIFORNIA Sc
- Page 122 and 123:
CITY OF SANTA MONICA, CALIFORNIA Sc
- Page 124 and 125: CITY OF SANTA MONICA, CALIFORNIA Sc
- Page 126 and 127: CITY OF SANTA MONICA, CALIFORNIA Sc
- Page 128 and 129: CITY OF SANTA MONICA, CALIFORNIA Sc
- Page 130 and 131: CITY OF SANTA MONICA, CALIFORNIA Sc
- Page 132 and 133: CITY OF SANTA MONICA, CALIFORNIA Co
- Page 134 and 135: CITY OF SANTA MONICA, CALIFORNIA Sc
- Page 136 and 137: CITY OF SANTA MONICA, CALIFORNIA Sc
- Page 138 and 139: CITY OF SANTA MONICA, CALIFORNIA Sc
- Page 140 and 141: CITY OF SANTA MONICA, CALIFORNIA Co
- Page 142 and 143: CITY OF SANTA MONICA, CALIFORNIA Co
- Page 144 and 145: THIS PAGE INTENTIONALLY LEFT BLANK
- Page 146 and 147: CITY OF SANTA MONICA, CALIFORNIA St
- Page 148 and 149: CITY OF SANTA MONICA, CALIFORNIA St
- Page 150 and 151: CITY OF SANTA MONICA, CALIFORNIA St
- Page 152 and 153: CITY OF SANTA MONICA, CALIFORNIA St
- Page 154 and 155: CITY OF SANTA MONICA, CALIFORNIA St
- Page 156 and 157: CITY OF SANTA MONICA, CALIFORNIA Co
- Page 158: THIS PAGE INTENTIONALLY LEFT BLANK
- Page 161 and 162: CITY OF SANTA MONICA, CALIFORNIA Fo
- Page 163 and 164: CITY OF SANTA MONICA, CALIFORNIA Ch
- Page 165 and 166: CITY OF SANTA MONICA, CALIFORNIA Ch
- Page 167 and 168: CITY OF SANTA MONICA, CALIFORNIA Ch
- Page 169 and 170: CITY OF SANTA MONICA, CALIFORNIA Ge
- Page 171 and 172: CITY OF SANTA MONICA, CALIFORNIA Di
- Page 173: CITY OF SANTA MONICA, CALIFORNIA Pr
- Page 177 and 178: CITY OF SANTA MONICA, CALIFORNIA Di
- Page 179 and 180: CITY OF SANTA MONICA, CALIFORNIA Wa
- Page 181 and 182: CITY OF SANTA MONICA, CALIFORNIA Re
- Page 183 and 184: CITY OF SANTA MONICA, CALIFORNIA Pr
- Page 185 and 186: CITY OF SANTA MONICA, CALIFORNIA Op
- Page 187: THIS PAGE INTENTIONALLY LEFT BLANK