CITY OF SANTA MONICA, CALIFORNIA Statement <strong>of</strong> Net Assets All Internal Service Funds June 30, 2009 Information Total Technology Self-Insurance Self-Insurance internal Vehicle Replacement Compre- Self-Insurance Self-Insurance Workers’ service Assets Management and Services hensive Bus Auto Compensation funds Current assets: Cash and investments $ 27,129,675 4,405,418 8,578,803 2,077,463 1,888,331 25,263,817 69,343,507 Receivables: Accounts 28,863 — — — 2,408 — 31,271 Interest 153,160 29,423 33,479 14,343 11,607 166,445 408,457 Inventory 52,219 — — — — — 52,219 Total current assets 27,363,917 4,434,841 8,612,282 2,091,806 1,902,346 25,430,262 69,835,454 130 Noncurrent assets: Capital assets: Machinery and equipment 32,728,476 1,967,644 2,849 7,386 919 10,065 34,717,339 Construction in progress 100,040 — — — — — 100,040 Less accumulated depreciation (19,144,736) (1,139,667) (2,849) (7,386) — (919) (10,065) (20,305,622) Net capital assets 13,683,780 827,977 — — — — 14,511,757 Total assets 41,047,697 5,262,818 8,612,282 2,091,806 1,902,346 25,430,262 84,347,211 Liabilities Current liabilities: Accounts payable 331,735 104,455 8,514 100,031 12,472 4,224 561,431 Accrued liabilities 129,838 — — — — 69,390 199,228 Claims payable — — 1,498,463 1,938,009 103,062 5,411,498 8,951,032 Total current liabilities 461,573 104,455 1,506,977 2,038,040 115,534 5,485,112 9,711,691 Noncurrent liabilities: Accrued liabilities 97,972 — — — — 73,735 171,707 Claims payable — — 2,135,999 968,414 67,872 16,730,387 19,902,672 Total noncurrent liabilities 97,972 — 2,135,999 968,414 67,872 16,804,122 20,074,379 Total liabilities 559,545 104,455 3,642,976 3,006,454 183,406 22,289,234 29,786,070 Net assets Net assets (deficit) Invested in capital assets 13,683,780 827,977 — — — — 14,511,757 Unrestricted 26,804,372 4,330,386 4,969,306 (914,648) 1,718,940 3,141,028 40,049,384 Total net assets $ 40,488,152 5,158,363 4,969,306 (914,648) 1,718,940 3,141,028 54,561,141
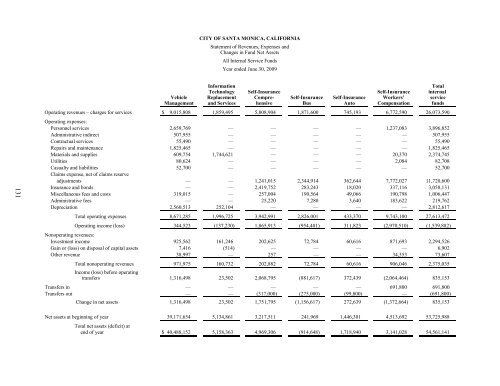
CITY OF SANTA MONICA, CALIFORNIA Statement <strong>of</strong> Revenues, Expenses and Changes in Fund Net Assets All Internal Service Funds Year ended June 30, 2009 131 Information Total Technology Self-Insurance Self-Insurance internal Vehicle Replacement Compre- Self-Insurance Self-Insurance Workers’ service Management and Services hensive Bus Auto Compensation funds Operating revenues – charges for services $ 9,015,808 1,859,495 5,808,904 1,871,600 745,193 6,772,590 — 26,073,590 Operating expenses: Personnel services 2,659,769 — — — — 1,237,083 3,896,852 Administrative indirect 507,955 — — — — — 507,955 Contractual services 55,490 — — — — — 55,490 Repairs and maintenance 1,825,465 — — — — — 1,825,465 Materials and supplies 609,754 1,744,621 — — — 20,370 2,374,745 Utilities 80,624 — — — — 2,084 82,708 Casualty and liabilities 52,700 — — — — — 52,700 Claims expense, net <strong>of</strong> claims reserve adjustments — — 1,241,015 2,344,914 362,644 7,772,027 11,720,600 Insurance and bonds — — 2,419,752 283,243 18,020 337,116 3,058,131 Miscellaneous fees and costs 319,015 — 257,004 190,564 49,066 190,798 1,006,447 Administrative fees — — 25,220 7,280 3,640 183,622 219,762 Depreciation 2,560,513 252,104 — — — — 2,812,617 Total operating expenses 8,671,285 1,996,725 3,942,991 2,826,001 433,370 9,743,100 27,613,472 Operating income (loss) 344,523 (137,230) 1,865,913 (954,401) 311,823 (2,970,510) (1,539,882) Nonoperating revenues: Investment income 925,562 161,246 202,625 72,784 60,616 871,693 2,294,526 Gain or (loss) on disposal <strong>of</strong> capital assets 7,416 (514) — — — — 6,902 Other revenue 38,997 — 257 — — 34,353 73,607 Total nonoperating revenues 971,975 160,732 202,882 72,784 60,616 906,046 2,375,035 Income (loss) before operating transfers 1,316,498 23,502 2,068,795 (881,617) 372,439 (2,064,464) 835,153 Transfers in — — — — — 691,800 691,800 Transfers out — — (317,000) (275,000) (99,800) — (691,800) Change in net assets 1,316,498 23,502 1,751,795 (1,156,617) 272,639 (1,372,664) 835,153 Net assets at beginning <strong>of</strong> year 39,171,654 5,134,861 3,217,511 241,969 1,446,301 4,513,692 53,725,988 Total net assets (deficit) at end <strong>of</strong> year $ 40,488,152 5,158,363 4,969,306 (914,648) 1,718,940 3,141,028 54,561,141
- Page 1:
Comprehensive Annual Financial Repo
- Page 5 and 6:
CITY OF SANTA MONICA, CALIFORNIA Co
- Page 7:
THIS PAGE INTENTIONALLY LEFT BLANK.
- Page 10 and 11:
amount of borrowed property taxes i
- Page 12 and 13:
five-year forecasts, and an underst
- Page 14 and 15:
Cash Management Policies and Practi
- Page 16 and 17:
OFFICIALS OF THE CITY OF SANTA MONI
- Page 18 and 19:
Certificate of Achievement for Exce
- Page 23 and 24:
CITY OF SANTA MONICA, CALIFORNIA Ma
- Page 25 and 26:
CITY OF SANTA MONICA, CALIFORNIA Ma
- Page 27 and 28:
CITY OF SANTA MONICA, CALIFORNIA Ma
- Page 29 and 30:
CITY OF SANTA MONICA, CALIFORNIA Ma
- Page 31 and 32:
CITY OF SANTA MONICA, CALIFORNIA Ma
- Page 33 and 34:
CITY OF SANTA MONICA, CALIFORNIA Ma
- Page 36 and 37:
CITY OF SANTA MONICA, CALIFORNIA St
- Page 38 and 39:
CITY OF SANTA MONICA, CALIFORNIA Ma
- Page 40 and 41:
CITY OF SANTA MONICA, CALIFORNIA St
- Page 42 and 43:
CITY OF SANTA MONICA, CALIFORNIA St
- Page 44 and 45:
CITY OF SANTA MONICA, CALIFORNIA St
- Page 46 and 47:
CITY OF SANTA MONICA, CALIFORNIA St
- Page 48 and 49:
CITY OF SANTA MONICA, CALIFORNIA Pr
- Page 50 and 51:
CITY OF SANTA MONICA, CALIFORNIA St
- Page 52 and 53:
CITY OF SANTA MONICA, CALIFORNIA St
- Page 54 and 55:
CITY OF SANTA MONICA, CALIFORNIA Fi
- Page 56 and 57:
CITY OF SANTA MONICA, CALIFORNIA No
- Page 58 and 59:
CITY OF SANTA MONICA, CALIFORNIA No
- Page 60 and 61:
CITY OF SANTA MONICA, CALIFORNIA No
- Page 62 and 63:
CITY OF SANTA MONICA, CALIFORNIA No
- Page 64 and 65:
CITY OF SANTA MONICA, CALIFORNIA No
- Page 66 and 67:
CITY OF SANTA MONICA, CALIFORNIA No
- Page 68 and 69:
CITY OF SANTA MONICA, CALIFORNIA No
- Page 70 and 71:
CITY OF SANTA MONICA, CALIFORNIA No
- Page 72 and 73:
CITY OF SANTA MONICA, CALIFORNIA No
- Page 74 and 75:
CITY OF SANTA MONICA, CALIFORNIA No
- Page 76 and 77:
CITY OF SANTA MONICA, CALIFORNIA No
- Page 78 and 79:
CITY OF SANTA MONICA, CALIFORNIA No
- Page 80 and 81:
CITY OF SANTA MONICA, CALIFORNIA No
- Page 82 and 83:
CITY OF SANTA MONICA, CALIFORNIA No
- Page 84 and 85:
CITY OF SANTA MONICA, CALIFORNIA No
- Page 86 and 87:
CITY OF SANTA MONICA, CALIFORNIA No
- Page 88 and 89:
CITY OF SANTA MONICA, CALIFORNIA No
- Page 90 and 91:
CITY OF SANTA MONICA, CALIFORNIA No
- Page 92 and 93:
CITY OF SANTA MONICA, CALIFORNIA No
- Page 94 and 95:
CITY OF SANTA MONICA, CALIFORNIA No
- Page 96 and 97:
CITY OF SANTA MONICA, CALIFORNIA No
- Page 98 and 99:
CITY OF SANTA MONICA, CALIFORNIA No
- Page 100 and 101:
CITY OF SANTA MONICA, CALIFORNIA No
- Page 102 and 103: CITY OF SANTA MONICA, CALIFORNIA No
- Page 104 and 105: CITY OF SANTA MONICA, CALIFORNIA No
- Page 106 and 107: CITY OF SANTA MONICA, CALIFORNIA No
- Page 108 and 109: CITY OF SANTA MONICA, CALIFORNIA No
- Page 110 and 111: City of Santa Monica, California Ye
- Page 112 and 113: CITY OF SANTA MONICA, CALIFORNIA Ca
- Page 114 and 115: CITY OF SANTA MONICA, CALIFORNIA Co
- Page 116 and 117: CITY OF SANTA MONICA, CALIFORNIA Co
- Page 118 and 119: CITY OF SANTA MONICA, CALIFORNIA Co
- Page 120 and 121: CITY OF SANTA MONICA, CALIFORNIA Sc
- Page 122 and 123: CITY OF SANTA MONICA, CALIFORNIA Sc
- Page 124 and 125: CITY OF SANTA MONICA, CALIFORNIA Sc
- Page 126 and 127: CITY OF SANTA MONICA, CALIFORNIA Sc
- Page 128 and 129: CITY OF SANTA MONICA, CALIFORNIA Sc
- Page 130 and 131: CITY OF SANTA MONICA, CALIFORNIA Sc
- Page 132 and 133: CITY OF SANTA MONICA, CALIFORNIA Co
- Page 134 and 135: CITY OF SANTA MONICA, CALIFORNIA Sc
- Page 136 and 137: CITY OF SANTA MONICA, CALIFORNIA Sc
- Page 138 and 139: CITY OF SANTA MONICA, CALIFORNIA Sc
- Page 140 and 141: CITY OF SANTA MONICA, CALIFORNIA Co
- Page 142 and 143: CITY OF SANTA MONICA, CALIFORNIA Co
- Page 144 and 145: THIS PAGE INTENTIONALLY LEFT BLANK
- Page 146 and 147: CITY OF SANTA MONICA, CALIFORNIA St
- Page 148 and 149: CITY OF SANTA MONICA, CALIFORNIA St
- Page 150 and 151: CITY OF SANTA MONICA, CALIFORNIA St
- Page 154 and 155: CITY OF SANTA MONICA, CALIFORNIA St
- Page 156 and 157: CITY OF SANTA MONICA, CALIFORNIA Co
- Page 158: THIS PAGE INTENTIONALLY LEFT BLANK
- Page 161 and 162: CITY OF SANTA MONICA, CALIFORNIA Fo
- Page 163 and 164: CITY OF SANTA MONICA, CALIFORNIA Ch
- Page 165 and 166: CITY OF SANTA MONICA, CALIFORNIA Ch
- Page 167 and 168: CITY OF SANTA MONICA, CALIFORNIA Ch
- Page 169 and 170: CITY OF SANTA MONICA, CALIFORNIA Ge
- Page 171 and 172: CITY OF SANTA MONICA, CALIFORNIA Di
- Page 173 and 174: CITY OF SANTA MONICA, CALIFORNIA Pr
- Page 175 and 176: CITY OF SANTA MONICA, CALIFORNIA Ra
- Page 177 and 178: CITY OF SANTA MONICA, CALIFORNIA Di
- Page 179 and 180: CITY OF SANTA MONICA, CALIFORNIA Wa
- Page 181 and 182: CITY OF SANTA MONICA, CALIFORNIA Re
- Page 183 and 184: CITY OF SANTA MONICA, CALIFORNIA Pr
- Page 185 and 186: CITY OF SANTA MONICA, CALIFORNIA Op
- Page 187: THIS PAGE INTENTIONALLY LEFT BLANK