CITY OF SANTA MONICA, CALIFORNIA Statement <strong>of</strong> Revenues, Expenditures and Changes in Fund Balance - Budget and Actual (Non-GAAP Basis) General Fund For the fiscal year ended June 30, 2009 21 Less Variance with 2007-2008 Plus Actual, final budget - Original Final encumbered 2008-2009 budgetary positive budget budget Actual expenditures encumbrances basis (negative) Revenues: Property taxes $ 34,858,533 35,364,371 36,763,026 — — 36,763,026 1,398,655 Sales tax 32,866,500 31,133,629 28,296,696 — — 28,296,696 (2,836,933) Other taxes 107,428,800 106,192,127 100,991,562 — — 100,991,562 (5,200,565) Licenses and permits 19,504,612 19,504,612 20,315,341 — — 20,315,341 810,729 Intergovernmental 648,900 753,900 652,174 — — 652,174 (101,726) Charges for services 26,768,162 27,363,865 28,122,186 — — 28,122,186 758,321 Fines and forfeitures 14,047,530 14,131,000 14,113,906 — — 14,113,906 (17,094) Investment income 4,700,000 4,807,000 5,411,464 — — 5,411,464 604,464 Rental income 5,441,455 5,251,455 5,388,721 — — 5,388,721 137,266 Other 3,822,620 3,822,620 7,510,002 — — 7,510,002 3,687,382 Total revenues 250,087,112 248,324,579 247,565,078 — — 247,565,078 (759,501) Expenditures: General government: <strong>City</strong> council Salaries 395,949 434,736 434,736 — — 434,736 — Supplies 202,222 271,295 208,359 — — 208,359 62,936 Total city council 598,171 706,031 643,095 — — 643,095 62,936 <strong>City</strong> manager Salaries 4,670,005 4,670,005 4,577,338 — — 4,577,338 92,667 Supplies 4,652,674 4,735,663 3,971,209 514,397 375,342 3,832,154 903,509 Capital outlay 28,000 28,000 30,687 20,963 — 9,724 18,276 Total city manager 9,350,679 9,433,668 8,579,234 535,360 375,342 8,419,216 1,014,452 Record and election services Salaries 1,316,145 1,316,145 1,263,857 — — 1,263,857 52,288 Supplies 1,279,633 1,276,883 1,043,442 7,473 40,772 1,076,741 200,142 Total record and election services 2,595,778 2,593,028 2,307,299 7,473 40,772 2,340,598 252,430 Finance Salaries 6,144,800 6,302,051 5,556,352 — — 5,556,352 745,699 Supplies 2,967,045 3,205,520 3,108,694 129,271 226,097 3,205,520 — Capital outlay 2,595 — — — — — — Total finance 9,114,440 9,507,571 8,665,046 129,271 226,097 8,761,872 745,699 See accompanying notes to basic financial statements. (Continued)
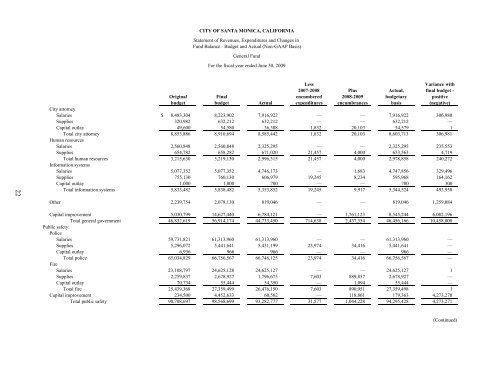
CITY OF SANTA MONICA, CALIFORNIA Statement <strong>of</strong> Revenues, Expenditures and Changes in Fund Balance - Budget and Actual (Non-GAAP Basis) General Fund For the fiscal year ended June 30, 2009 22 Less Variance with 2007-2008 Plus Actual, final budget - Original Final encumbered 2008-2009 budgetary positive budget budget Actual expenditures encumbrances basis (negative) <strong>City</strong> attorney Salaries $ 8,483,304 8,223,902 7,916,922 — — 7,916,922 306,980 Supplies 320,982 632,212 632,212 — — 632,212 — Capital outlay 49,600 54,580 36,308 1,832 20,103 54,579 1 Total city attorney 8,853,886 8,910,694 8,585,442 1,832 20,103 8,603,713 306,981 Human resources Salaries 2,560,848 2,560,848 2,325,295 — — 2,325,295 235,553 Supplies 654,782 658,282 671,020 21,457 4,000 653,563 4,719 Total human resources 3,215,630 3,219,130 2,996,315 21,457 4,000 2,978,858 240,272 Information systems Salaries 5,077,352 5,077,352 4,746,173 — 1,683 4,747,856 329,496 Supplies 755,130 760,130 606,979 19,245 8,234 595,968 164,162 Capital outlay 1,000 1,000 700 — — 700 300 Total information systems 5,833,482 5,838,482 5,353,852 19,245 9,917 5,344,524 493,958 Other 2,239,754 2,078,130 819,046 — — 819,046 1,259,084 Capital improvement 5,030,799 14,627,440 6,784,121 — 1,761,123 8,545,244 6,082,196 Total general government 46,832,619 56,914,174 44,733,450 714,638 2,437,354 46,456,166 10,458,008 Public safety: Police Salaries 59,731,821 61,313,960 61,313,960 — — 61,313,960 — Supplies 5,296,072 5,441,641 5,431,199 23,974 34,416 5,441,641 — Capital outlay 6,936 966 966 — — 966 — Total police 65,034,829 66,756,567 66,746,125 23,974 34,416 66,756,567 — Fire Salaries 23,108,797 24,625,128 24,625,127 — — 24,625,127 1 Supplies 2,259,837 2,678,927 1,796,673 7,603 889,857 2,678,927 — Capital outlay 70,734 55,444 54,350 — 1,094 55,444 — Total fire 25,439,368 27,359,499 26,476,150 7,603 890,951 27,359,498 1 Capital improvement 234,500 4,452,633 60,502 — 118,861 179,363 4,273,270 Total public safety 90,708,697 98,568,699 93,282,777 31,577 1,044,228 94,295,428 4,273,271 (Continued)
- Page 1: Comprehensive Annual Financial Repo
- Page 5 and 6: CITY OF SANTA MONICA, CALIFORNIA Co
- Page 7: THIS PAGE INTENTIONALLY LEFT BLANK.
- Page 10 and 11: amount of borrowed property taxes i
- Page 12 and 13: five-year forecasts, and an underst
- Page 14 and 15: Cash Management Policies and Practi
- Page 16 and 17: OFFICIALS OF THE CITY OF SANTA MONI
- Page 18 and 19: Certificate of Achievement for Exce
- Page 23 and 24: CITY OF SANTA MONICA, CALIFORNIA Ma
- Page 25 and 26: CITY OF SANTA MONICA, CALIFORNIA Ma
- Page 27 and 28: CITY OF SANTA MONICA, CALIFORNIA Ma
- Page 29 and 30: CITY OF SANTA MONICA, CALIFORNIA Ma
- Page 31 and 32: CITY OF SANTA MONICA, CALIFORNIA Ma
- Page 33 and 34: CITY OF SANTA MONICA, CALIFORNIA Ma
- Page 36 and 37: CITY OF SANTA MONICA, CALIFORNIA St
- Page 38 and 39: CITY OF SANTA MONICA, CALIFORNIA Ma
- Page 40 and 41: CITY OF SANTA MONICA, CALIFORNIA St
- Page 44 and 45: CITY OF SANTA MONICA, CALIFORNIA St
- Page 46 and 47: CITY OF SANTA MONICA, CALIFORNIA St
- Page 48 and 49: CITY OF SANTA MONICA, CALIFORNIA Pr
- Page 50 and 51: CITY OF SANTA MONICA, CALIFORNIA St
- Page 52 and 53: CITY OF SANTA MONICA, CALIFORNIA St
- Page 54 and 55: CITY OF SANTA MONICA, CALIFORNIA Fi
- Page 56 and 57: CITY OF SANTA MONICA, CALIFORNIA No
- Page 58 and 59: CITY OF SANTA MONICA, CALIFORNIA No
- Page 60 and 61: CITY OF SANTA MONICA, CALIFORNIA No
- Page 62 and 63: CITY OF SANTA MONICA, CALIFORNIA No
- Page 64 and 65: CITY OF SANTA MONICA, CALIFORNIA No
- Page 66 and 67: CITY OF SANTA MONICA, CALIFORNIA No
- Page 68 and 69: CITY OF SANTA MONICA, CALIFORNIA No
- Page 70 and 71: CITY OF SANTA MONICA, CALIFORNIA No
- Page 72 and 73: CITY OF SANTA MONICA, CALIFORNIA No
- Page 74 and 75: CITY OF SANTA MONICA, CALIFORNIA No
- Page 76 and 77: CITY OF SANTA MONICA, CALIFORNIA No
- Page 78 and 79: CITY OF SANTA MONICA, CALIFORNIA No
- Page 80 and 81: CITY OF SANTA MONICA, CALIFORNIA No
- Page 82 and 83: CITY OF SANTA MONICA, CALIFORNIA No
- Page 84 and 85: CITY OF SANTA MONICA, CALIFORNIA No
- Page 86 and 87: CITY OF SANTA MONICA, CALIFORNIA No
- Page 88 and 89: CITY OF SANTA MONICA, CALIFORNIA No
- Page 90 and 91: CITY OF SANTA MONICA, CALIFORNIA No
- Page 92 and 93:
CITY OF SANTA MONICA, CALIFORNIA No
- Page 94 and 95:
CITY OF SANTA MONICA, CALIFORNIA No
- Page 96 and 97:
CITY OF SANTA MONICA, CALIFORNIA No
- Page 98 and 99:
CITY OF SANTA MONICA, CALIFORNIA No
- Page 100 and 101:
CITY OF SANTA MONICA, CALIFORNIA No
- Page 102 and 103:
CITY OF SANTA MONICA, CALIFORNIA No
- Page 104 and 105:
CITY OF SANTA MONICA, CALIFORNIA No
- Page 106 and 107:
CITY OF SANTA MONICA, CALIFORNIA No
- Page 108 and 109:
CITY OF SANTA MONICA, CALIFORNIA No
- Page 110 and 111:
City of Santa Monica, California Ye
- Page 112 and 113:
CITY OF SANTA MONICA, CALIFORNIA Ca
- Page 114 and 115:
CITY OF SANTA MONICA, CALIFORNIA Co
- Page 116 and 117:
CITY OF SANTA MONICA, CALIFORNIA Co
- Page 118 and 119:
CITY OF SANTA MONICA, CALIFORNIA Co
- Page 120 and 121:
CITY OF SANTA MONICA, CALIFORNIA Sc
- Page 122 and 123:
CITY OF SANTA MONICA, CALIFORNIA Sc
- Page 124 and 125:
CITY OF SANTA MONICA, CALIFORNIA Sc
- Page 126 and 127:
CITY OF SANTA MONICA, CALIFORNIA Sc
- Page 128 and 129:
CITY OF SANTA MONICA, CALIFORNIA Sc
- Page 130 and 131:
CITY OF SANTA MONICA, CALIFORNIA Sc
- Page 132 and 133:
CITY OF SANTA MONICA, CALIFORNIA Co
- Page 134 and 135:
CITY OF SANTA MONICA, CALIFORNIA Sc
- Page 136 and 137:
CITY OF SANTA MONICA, CALIFORNIA Sc
- Page 138 and 139:
CITY OF SANTA MONICA, CALIFORNIA Sc
- Page 140 and 141:
CITY OF SANTA MONICA, CALIFORNIA Co
- Page 142 and 143:
CITY OF SANTA MONICA, CALIFORNIA Co
- Page 144 and 145:
THIS PAGE INTENTIONALLY LEFT BLANK
- Page 146 and 147:
CITY OF SANTA MONICA, CALIFORNIA St
- Page 148 and 149:
CITY OF SANTA MONICA, CALIFORNIA St
- Page 150 and 151:
CITY OF SANTA MONICA, CALIFORNIA St
- Page 152 and 153:
CITY OF SANTA MONICA, CALIFORNIA St
- Page 154 and 155:
CITY OF SANTA MONICA, CALIFORNIA St
- Page 156 and 157:
CITY OF SANTA MONICA, CALIFORNIA Co
- Page 158:
THIS PAGE INTENTIONALLY LEFT BLANK
- Page 161 and 162:
CITY OF SANTA MONICA, CALIFORNIA Fo
- Page 163 and 164:
CITY OF SANTA MONICA, CALIFORNIA Ch
- Page 165 and 166:
CITY OF SANTA MONICA, CALIFORNIA Ch
- Page 167 and 168:
CITY OF SANTA MONICA, CALIFORNIA Ch
- Page 169 and 170:
CITY OF SANTA MONICA, CALIFORNIA Ge
- Page 171 and 172:
CITY OF SANTA MONICA, CALIFORNIA Di
- Page 173 and 174:
CITY OF SANTA MONICA, CALIFORNIA Pr
- Page 175 and 176:
CITY OF SANTA MONICA, CALIFORNIA Ra
- Page 177 and 178:
CITY OF SANTA MONICA, CALIFORNIA Di
- Page 179 and 180:
CITY OF SANTA MONICA, CALIFORNIA Wa
- Page 181 and 182:
CITY OF SANTA MONICA, CALIFORNIA Re
- Page 183 and 184:
CITY OF SANTA MONICA, CALIFORNIA Pr
- Page 185 and 186:
CITY OF SANTA MONICA, CALIFORNIA Op
- Page 187:
THIS PAGE INTENTIONALLY LEFT BLANK