

Comprehensive Annual Financial Report - City of Santa Monica
Comprehensive Annual Financial Report - City of Santa Monica
Comprehensive Annual Financial Report - City of Santa Monica

Create successful ePaper yourself
Turn your PDF publications into a flip-book with our unique Google optimized e-Paper software.
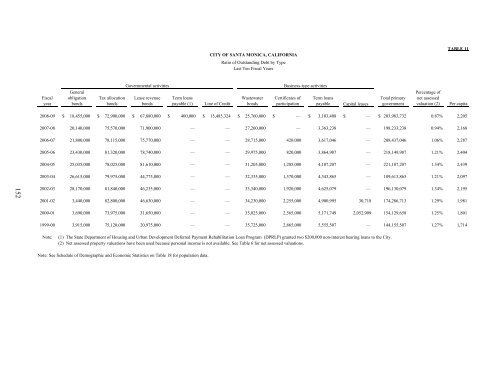
CITY OF SANTA MONICA, CALIFORNIA<br />
Ratio <strong>of</strong> Outstanding Debt by Type<br />
Last Ten Fiscal Years<br />
TABLE 11<br />
Fiscal<br />
year<br />
General<br />
obligation<br />
bonds<br />
Tax allocation<br />
bonds<br />
Governmental activities<br />
Lease revenue<br />
bonds<br />
Term loans<br />
payable (1)<br />
Line <strong>of</strong> Credit<br />
Wastewater<br />
bonds<br />
Business-type activities<br />
Certificates <strong>of</strong><br />
participation<br />
Term loans<br />
payable<br />
Capital leases<br />
Total primary<br />
government<br />
Percentage <strong>of</strong><br />
net assessed<br />
valuation (2)<br />
Per capita<br />
2008-09 $ 18,455,000 $ 72,900,000 $ 67,880,000 $ 400,000 $ 15,485,324 $ 25,760,000 $ — $ 3,103,408 $ — $ 203,983,732<br />
0.87% 2,205<br />
2007-08 20,140,000 75,570,000 71,900,000 — — 27,260,000 — 3,363,238 — 198,233,238 0.94% 2,168<br />
2006-07 21,800,000 78,115,000 75,770,000 — — 28,715,000 420,000 3,617,046 — 208,437,046 1.06% 2,287<br />
2005-06 23,430,000 81,320,000 78,740,000 — — 29,975,000 820,000 3,864,987 — 218,149,987 1.21% 2,404<br />
2004-05 25,035,000 78,025,000 81,610,000 — — 31,205,000 1,205,000 4,107,207 — 221,187,207 1.34% 2,439<br />
2003-04 26,615,000 79,975,000 44,775,000 — — 32,335,000 1,570,000 4,343,865 — 189,613,865 1.21% 2,097<br />
152<br />
2002-03 28,170,000 81,840,000 46,235,000 — — 33,340,000 1,920,000 4,625,079 — 196,130,079 1.34% 2,195<br />
2001-02 3,440,000 82,800,000 46,630,000 — — 34,230,000 2,255,000 4,900,995 30,718 174,286,713 1.29% 1,981<br />
2000-01 3,690,000 73,975,000 31,650,000 — — 35,025,000 2,565,000 5,171,749 2,052,909 154,129,658 1.25% 1,801<br />
1999-00 3,915,000 75,120,000 20,975,000 — — 35,725,000 2,865,000 5,555,507 — 144,155,507 1.27% 1,714<br />
Note:<br />
(1) The State Department <strong>of</strong> Housing and Urban Development Deferred Payment Rehabilitation Loan Program (DPRLP) granted two $200,000 non-interest bearing loans to the <strong>City</strong>.<br />
(2) Net assessed property valuations have been used because personal income is not available. See Table 6 for net assessed valuations.<br />
Note: See Schedule <strong>of</strong> Demographic and Economic Statistics on Table 18 for population data.


