CITY OF SANTA MONICA, CALIFORNIA Statement <strong>of</strong> Cash Flows Proprietary Funds For the fiscal year ended June 30, 2009 31 Total Nonmajor Total internal Big Blue enterprise enterprise service Wastewater Bus funds funds funds Cash flows from operating activities: Cash received from customers $ 14,174,795 14,391,300 50,769,332 79,335,427 26,123,883 Cash payments for materials and services (12,344,367) (17,315,637) (31,393,395) (61,053,399) (9,013,505) Cash paid for claims and related services — — — — (9,907,755) Cash payments to employees for services (2,048,364) (34,700,741) (18,859,997) (55,609,102) (3,967,469) Other revenue received 339,144 2,408,943 1,367,784 4,115,871 73,607 Net cash provided by operating activities 121,208 (35,216,135) 1,883,724 (33,211,203) 3,308,761 Cash flows from noncapital financing activities: Sales tax proceeds — 35,902,303 — 35,902,303 — Advances from other funds — — 1,599,262 1,599,262 — Repayment <strong>of</strong> advances made to other funds 6,514,322 — 520,298 7,034,620 — Repayment <strong>of</strong> advances received from other funds (6,500,000) — — (6,500,000) — Transfers in 7,237,304 538,597 8,244,511 16,020,412 691,800 Transfers out (833,700) (387,300) (8,692,395) (9,913,395) (691,800) Net cash provided by noncapital financing activities 6,417,926 36,053,600 1,671,676 44,143,202 — Cash flows from capital and related financing activities Capital contributions received — 50,410,034 — 50,410,034 — Acquisition and construction <strong>of</strong> capital assets (11,082,213) (39,333,970) (3,138,348) (53,554,531) (3,683,572) Proceeds from sale <strong>of</strong> capital assets (55,077) 8,766 204,041 157,730 108,699 Reduction in long-term obligations (1,239,486) — (259,830) (1,499,316) — Payments due to other governments 2,700,000 — (534,129) 2,165,871 — Interest paid on long-term obligations (1,237,459) — (522,533) (1,759,992) — Net cash used in capital and related financing activities (10,914,235) 11,084,830 (4,250,799) (4,080,204) (3,574,873) Cash flows from investing activities – interest received on investments 934,394 578,904 2,023,162 3,536,460 2,528,131 Net cash provided by investing activities 934,394 578,904 2,023,162 3,536,460 2,528,131 Net increase (decrease) in cash and cash equivalents (3,440,707) 12,501,199 1,327,763 10,388,255 2,262,019 Cash and cash equivalents at beginning <strong>of</strong> year 28,078,042 16,644,522 51,574,174 96,296,738 67,081,488 Cash and cash equivalents at end <strong>of</strong> year $ 24,637,335 29,145,721 52,901,937 106,684,993 69,343,507 Cash and investments $ 22,799,350 24,472,034 41,376,283 88,647,667 69,343,507 Restricted cash and investments 1,837,985 4,673,686 11,525,654 18,037,325 — Total cash and cash equivalents $ 24,637,335 29,145,720 52,901,937 106,684,992 69,343,507 (Continued)
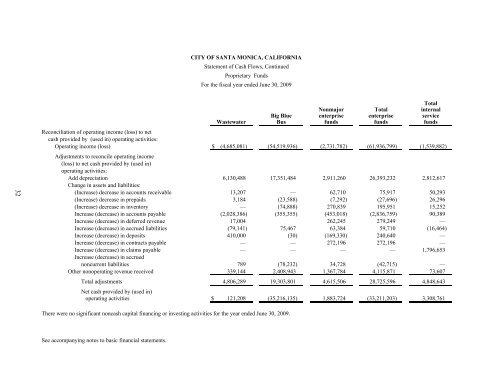
CITY OF SANTA MONICA, CALIFORNIA Statement <strong>of</strong> Cash Flows, Continued Proprietary Funds For the fiscal year ended June 30, 2009 32 Total Nonmajor Total internal Big Blue enterprise enterprise service Wastewater Bus funds funds funds Reconciliation <strong>of</strong> operating income (loss) to net cash provided by (used in) operating activities: Operating income (loss) $ (4,685,081) (54,519,936) (2,731,782) (61,936,799) (1,539,882) Adjustments to reconcile operating income (loss) to net cash provided by (used in) operating activities: Add depreciation 6,130,488 17,351,484 2,911,260 26,393,232 2,812,617 Change in assets and liabilities: (Increase) decrease in accounts receivable 13,207 — 62,710 75,917 50,293 (Increase) decrease in prepaids 3,184 (23,588) (7,292) (27,696) 26,296 (Increase) decrease in inventory — (74,888) 270,839 195,951 15,252 Increase (decrease) in accounts payable (2,028,386) (355,355) (453,018) (2,836,759) 90,389 Increase (decrease) in deferred revenue 17,004 262,245 279,249 — Increase (decrease) in accrued liabilities (79,141) 75,467 63,384 59,710 (16,464) Increase (decrease) in deposits 410,000 (30) (169,330) 240,640 — Increase (decrease) in contracts payable — — 272,196 272,196 — Increase (decrease) in claims payable — — — — 1,796,653 Increase (decrease) in accrued noncurrent liabilities 789 (78,232) 34,728 (42,715) — Other nonoperating revenue received 339,144 2,408,943 1,367,784 4,115,871 73,607 Total adjustments 4,806,289 19,303,801 4,615,506 28,725,596 4,848,643 Net cash provided by (used in) operating activities $ 121,208 (35,216,135) 1,883,724 (33,211,203) 3,308,761 There were no significant noncash capital financing or investing activities for the year ended June 30, 2009. See accompanying notes to basic financial statements.
- Page 1: Comprehensive Annual Financial Repo
- Page 5 and 6: CITY OF SANTA MONICA, CALIFORNIA Co
- Page 7: THIS PAGE INTENTIONALLY LEFT BLANK.
- Page 10 and 11: amount of borrowed property taxes i
- Page 12 and 13: five-year forecasts, and an underst
- Page 14 and 15: Cash Management Policies and Practi
- Page 16 and 17: OFFICIALS OF THE CITY OF SANTA MONI
- Page 18 and 19: Certificate of Achievement for Exce
- Page 23 and 24: CITY OF SANTA MONICA, CALIFORNIA Ma
- Page 25 and 26: CITY OF SANTA MONICA, CALIFORNIA Ma
- Page 27 and 28: CITY OF SANTA MONICA, CALIFORNIA Ma
- Page 29 and 30: CITY OF SANTA MONICA, CALIFORNIA Ma
- Page 31 and 32: CITY OF SANTA MONICA, CALIFORNIA Ma
- Page 33 and 34: CITY OF SANTA MONICA, CALIFORNIA Ma
- Page 36 and 37: CITY OF SANTA MONICA, CALIFORNIA St
- Page 38 and 39: CITY OF SANTA MONICA, CALIFORNIA Ma
- Page 40 and 41: CITY OF SANTA MONICA, CALIFORNIA St
- Page 42 and 43: CITY OF SANTA MONICA, CALIFORNIA St
- Page 44 and 45: CITY OF SANTA MONICA, CALIFORNIA St
- Page 46 and 47: CITY OF SANTA MONICA, CALIFORNIA St
- Page 48 and 49: CITY OF SANTA MONICA, CALIFORNIA Pr
- Page 50 and 51: CITY OF SANTA MONICA, CALIFORNIA St
- Page 54 and 55: CITY OF SANTA MONICA, CALIFORNIA Fi
- Page 56 and 57: CITY OF SANTA MONICA, CALIFORNIA No
- Page 58 and 59: CITY OF SANTA MONICA, CALIFORNIA No
- Page 60 and 61: CITY OF SANTA MONICA, CALIFORNIA No
- Page 62 and 63: CITY OF SANTA MONICA, CALIFORNIA No
- Page 64 and 65: CITY OF SANTA MONICA, CALIFORNIA No
- Page 66 and 67: CITY OF SANTA MONICA, CALIFORNIA No
- Page 68 and 69: CITY OF SANTA MONICA, CALIFORNIA No
- Page 70 and 71: CITY OF SANTA MONICA, CALIFORNIA No
- Page 72 and 73: CITY OF SANTA MONICA, CALIFORNIA No
- Page 74 and 75: CITY OF SANTA MONICA, CALIFORNIA No
- Page 76 and 77: CITY OF SANTA MONICA, CALIFORNIA No
- Page 78 and 79: CITY OF SANTA MONICA, CALIFORNIA No
- Page 80 and 81: CITY OF SANTA MONICA, CALIFORNIA No
- Page 82 and 83: CITY OF SANTA MONICA, CALIFORNIA No
- Page 84 and 85: CITY OF SANTA MONICA, CALIFORNIA No
- Page 86 and 87: CITY OF SANTA MONICA, CALIFORNIA No
- Page 88 and 89: CITY OF SANTA MONICA, CALIFORNIA No
- Page 90 and 91: CITY OF SANTA MONICA, CALIFORNIA No
- Page 92 and 93: CITY OF SANTA MONICA, CALIFORNIA No
- Page 94 and 95: CITY OF SANTA MONICA, CALIFORNIA No
- Page 96 and 97: CITY OF SANTA MONICA, CALIFORNIA No
- Page 98 and 99: CITY OF SANTA MONICA, CALIFORNIA No
- Page 100 and 101: CITY OF SANTA MONICA, CALIFORNIA No
- Page 102 and 103:
CITY OF SANTA MONICA, CALIFORNIA No
- Page 104 and 105:
CITY OF SANTA MONICA, CALIFORNIA No
- Page 106 and 107:
CITY OF SANTA MONICA, CALIFORNIA No
- Page 108 and 109:
CITY OF SANTA MONICA, CALIFORNIA No
- Page 110 and 111:
City of Santa Monica, California Ye
- Page 112 and 113:
CITY OF SANTA MONICA, CALIFORNIA Ca
- Page 114 and 115:
CITY OF SANTA MONICA, CALIFORNIA Co
- Page 116 and 117:
CITY OF SANTA MONICA, CALIFORNIA Co
- Page 118 and 119:
CITY OF SANTA MONICA, CALIFORNIA Co
- Page 120 and 121:
CITY OF SANTA MONICA, CALIFORNIA Sc
- Page 122 and 123:
CITY OF SANTA MONICA, CALIFORNIA Sc
- Page 124 and 125:
CITY OF SANTA MONICA, CALIFORNIA Sc
- Page 126 and 127:
CITY OF SANTA MONICA, CALIFORNIA Sc
- Page 128 and 129:
CITY OF SANTA MONICA, CALIFORNIA Sc
- Page 130 and 131:
CITY OF SANTA MONICA, CALIFORNIA Sc
- Page 132 and 133:
CITY OF SANTA MONICA, CALIFORNIA Co
- Page 134 and 135:
CITY OF SANTA MONICA, CALIFORNIA Sc
- Page 136 and 137:
CITY OF SANTA MONICA, CALIFORNIA Sc
- Page 138 and 139:
CITY OF SANTA MONICA, CALIFORNIA Sc
- Page 140 and 141:
CITY OF SANTA MONICA, CALIFORNIA Co
- Page 142 and 143:
CITY OF SANTA MONICA, CALIFORNIA Co
- Page 144 and 145:
THIS PAGE INTENTIONALLY LEFT BLANK
- Page 146 and 147:
CITY OF SANTA MONICA, CALIFORNIA St
- Page 148 and 149:
CITY OF SANTA MONICA, CALIFORNIA St
- Page 150 and 151:
CITY OF SANTA MONICA, CALIFORNIA St
- Page 152 and 153:
CITY OF SANTA MONICA, CALIFORNIA St
- Page 154 and 155:
CITY OF SANTA MONICA, CALIFORNIA St
- Page 156 and 157:
CITY OF SANTA MONICA, CALIFORNIA Co
- Page 158:
THIS PAGE INTENTIONALLY LEFT BLANK
- Page 161 and 162:
CITY OF SANTA MONICA, CALIFORNIA Fo
- Page 163 and 164:
CITY OF SANTA MONICA, CALIFORNIA Ch
- Page 165 and 166:
CITY OF SANTA MONICA, CALIFORNIA Ch
- Page 167 and 168:
CITY OF SANTA MONICA, CALIFORNIA Ch
- Page 169 and 170:
CITY OF SANTA MONICA, CALIFORNIA Ge
- Page 171 and 172:
CITY OF SANTA MONICA, CALIFORNIA Di
- Page 173 and 174:
CITY OF SANTA MONICA, CALIFORNIA Pr
- Page 175 and 176:
CITY OF SANTA MONICA, CALIFORNIA Ra
- Page 177 and 178:
CITY OF SANTA MONICA, CALIFORNIA Di
- Page 179 and 180:
CITY OF SANTA MONICA, CALIFORNIA Wa
- Page 181 and 182:
CITY OF SANTA MONICA, CALIFORNIA Re
- Page 183 and 184:
CITY OF SANTA MONICA, CALIFORNIA Pr
- Page 185 and 186:
CITY OF SANTA MONICA, CALIFORNIA Op
- Page 187:
THIS PAGE INTENTIONALLY LEFT BLANK