

Comprehensive Annual Financial Report - City of Santa Monica
Comprehensive Annual Financial Report - City of Santa Monica
Comprehensive Annual Financial Report - City of Santa Monica

You also want an ePaper? Increase the reach of your titles
YUMPU automatically turns print PDFs into web optimized ePapers that Google loves.
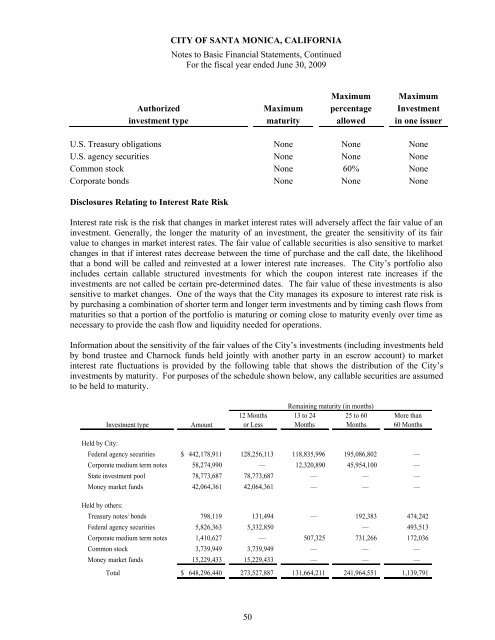
CITY OF SANTA MONICA, CALIFORNIA<br />
Notes to Basic <strong>Financial</strong> Statements, Continued<br />
For the fiscal year ended June 30, 2009<br />
Maximum Maximum<br />
Authorized Maximum percentage Investment<br />
investment type maturity allowed in one issuer<br />
U.S. Treasury obligations None None None<br />
U.S. agency securities None None None<br />
Common stock None 60% None<br />
Corporate bonds None None None<br />
Disclosures Relating to Interest Rate Risk<br />
Interest rate risk is the risk that changes in market interest rates will adversely affect the fair value <strong>of</strong> an<br />
investment. Generally, the longer the maturity <strong>of</strong> an investment, the greater the sensitivity <strong>of</strong> its fair<br />
value to changes in market interest rates. The fair value <strong>of</strong> callable securities is also sensitive to market<br />
changes in that if interest rates decrease between the time <strong>of</strong> purchase and the call date, the likelihood<br />
that a bond will be called and reinvested at a lower interest rate increases. The <strong>City</strong>’s portfolio also<br />
includes certain callable structured investments for which the coupon interest rate increases if the<br />
investments are not called be certain pre-determined dates. The fair value <strong>of</strong> these investments is also<br />
sensitive to market changes. One <strong>of</strong> the ways that the <strong>City</strong> manages its exposure to interest rate risk is<br />
by purchasing a combination <strong>of</strong> shorter term and longer term investments and by timing cash flows from<br />
maturities so that a portion <strong>of</strong> the portfolio is maturing or coming close to maturity evenly over time as<br />
necessary to provide the cash flow and liquidity needed for operations.<br />
Information about the sensitivity <strong>of</strong> the fair values <strong>of</strong> the <strong>City</strong>’s investments (including investments held<br />
by bond trustee and Charnock funds held jointly with another party in an escrow account) to market<br />
interest rate fluctuations is provided by the following table that shows the distribution <strong>of</strong> the <strong>City</strong>’s<br />
investments by maturity. For purposes <strong>of</strong> the schedule shown below, any callable securities are assumed<br />
to be held to maturity.<br />
Investment type<br />
Amount<br />
12 Months<br />
or Less<br />
Remaining maturity (in months)<br />
13 to 24 25 to 60<br />
Months Months<br />
More than<br />
60 Months<br />
Held by <strong>City</strong>:<br />
Federal agency securities $ 442,178,911 128,256,113 118,835,996 195,086,802 —<br />
Corporate medium term notes 58,274,990 — 12,320,890 45,954,100 —<br />
State investment pool 78,773,687 78,773,687 — — —<br />
Money market funds 42,064,361 42,064,361 — — —<br />
Held by others:<br />
Treasury notes/ bonds 798,119 131,494 — 192,383 474,242<br />
Federal agency securities 5,826,363 5,332,850 — 493,513<br />
Corporate medium term notes 1,410,627 — 507,325 731,266 172,036<br />
Common stock 3,739,949 3,739,949 — — —<br />
Money market funds 15,229,433 15,229,433 — — —<br />
Total $ 648,296,440 273,527,887 131,664,211 241,964,551 1,139,791<br />
50


