

Comprehensive Annual Financial Report - City of Santa Monica
Comprehensive Annual Financial Report - City of Santa Monica
Comprehensive Annual Financial Report - City of Santa Monica

You also want an ePaper? Increase the reach of your titles
YUMPU automatically turns print PDFs into web optimized ePapers that Google loves.
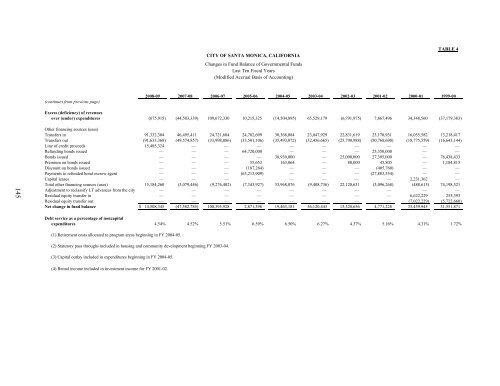
CITY OF SANTA MONICA, CALIFORNIA<br />
Changes in Fund Balance <strong>of</strong> Governmental Funds<br />
Last Ten Fiscal Years<br />
(Modified Accrual Basis <strong>of</strong> Accounting)<br />
TABLE 4<br />
(continues from previous page)<br />
2008-09 2007-08 2006-07 2005-06 2004-05 2003-04 2002-03 2001-02 2000-01 1999-00<br />
Excess (deficiency) <strong>of</strong> revenues<br />
over (under) expenditures (675,915) (44,503,339) 109,672,330 10,215,325 (14,504,895) 65,529,179 (6,791,975) 7,867,496 34,348,560 (37,179,383)<br />
145<br />
Other financing sources (uses)<br />
Transfers in 91,332,304 46,495,411 24,721,684 24,782,699 30,368,084 23,047,929 22,831,619 23,170,931 16,055,582 13,218,417<br />
Transfers out (91,633,368) (49,574,857) (33,998,086) (33,501,106) (35,493,072) (32,456,665) (25,790,988) (50,768,690) (18,775,559) (16,643,144)<br />
Line <strong>of</strong> credit proceeds 15,485,324 — — — — — — — — —<br />
Refunding bonds issued — — — 64,720,000 — — — 25,350,000 — —<br />
Bonds issued — — — — 38,930,000 — 25,000,000 27,395,000 — 76,438,433<br />
Premium on bonds issued — — — 55,653 163,064 — 80,000 45,805 — 1,184,815<br />
Discount on bonds issued — — — (187,264) — — — (405,760) — —<br />
Payments to refunded bond escrow agent — — — (63,213,909) — — — (27,883,554) — —<br />
Capital leases — — — — — — — — 2,231,362 —<br />
Total other financing sources (uses) 15,184,260 (3,079,446) (9,276,402) (7,343,927) 33,968,076 (9,408,736) 22,120,631 (3,096,268) (488,615) 74,198,521<br />
Adjustment to reclassify LT advances from the city — — — — — — — — — —<br />
Residual equity transfer in — — — — — — — — 6,622,229 255,393<br />
Residual equity transfer out — — — — — — — — (7,022,229) (5,722,660)<br />
Net change in fund balance $ 14,508,345 (47,582,785) 100,395,928 2,871,398 19,463,181 56,120,443 15,328,656 4,771,228 33,459,945 31,551,871<br />
Debt service as a percentage <strong>of</strong> noncapital<br />
expenditures 4.54% 4.52% 5.51% 6.59% 6.50% 6.27% 4.37% 5.16% 4.31% 1.72%<br />
(1) Retirement costs allocated to program areas beginning in FY 2004-05.<br />
(2) Statutory pass throughs included in housing and community development beginning FY 2003-04.<br />
(3) Capital outlay included in expenditures beginning in FY 2004-05.<br />
(4) Rental income included in investment income for FY 2001-02.


