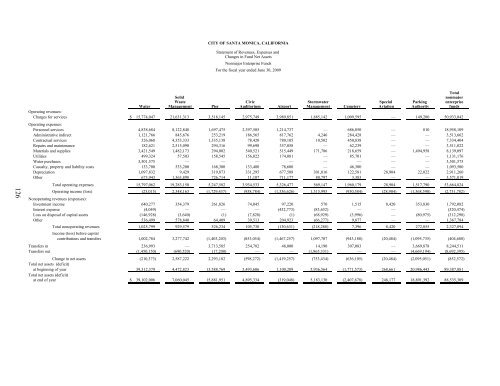
CITY OF SANTA MONICA, CALIFORNIA Statement <strong>of</strong> Revenues, Expenses and Changes in Fund Net Assets Nonmajor Enterprise Funds For the fiscal year ended June 30, 2009 126 Total Solid nonmajor Waste Civic Stormwater Special Parking enterprise Water Management Pier Auditorium Airport Management Cemetery Aviation Authority funds Operating revenues: Charges for services $ 15,774,047 21,631,313 3,518,145 2,975,749 3,989,851 1,885,142 1,009,595 — 149,200 50,933,042 Operating expenses: Personnel services 4,838,684 8,122,848 1,697,475 2,397,505 1,214,737 — 686,050 — 810 18,958,109 Administrative indirect 1,121,766 845,676 253,219 186,565 817,762 4,246 284,428 — — 3,513,662 Contractual services 326,068 4,353,333 1,335,138 78,420 780,105 10,502 450,838 — — 7,334,404 Repairs and maintenance 182,621 2,515,090 294,316 99,698 357,058 — 62,239 — — 3,511,022 Materials and supplies 3,421,549 1,482,173 294,002 540,521 515,449 171,786 218,659 — 1,494,958 8,139,097 Utilities 499,324 57,503 158,545 156,022 174,081 — 85,701 — — 1,131,176 Water purchases 3,501,575 — — — — — — — — 3,501,575 Casualty, property and liability costs 133,700 533,200 168,300 133,400 78,600 — 46,300 — — 1,093,500 Depreciation 1,097,832 9,429 319,873 331,295 677,508 301,816 122,581 28,904 22,022 2,911,260 Other 673,943 1,363,898 726,714 11,107 711,177 80,797 3,383 — — 3,571,019 Total operating expenses 15,797,062 19,283,150 5,247,582 3,934,533 5,326,477 569,147 1,960,179 28,904 1,517,790 53,664,824 Operating income (loss) (23,015) 2,348,163 (1,729,437) (958,784) (1,336,626) 1,315,995 (950,584) (28,904) (1,368,590) (2,731,782) Nonoperating revenues (expenses): Investment income 640,277 354,379 261,826 74,045 97,220 570 1,515 8,420 353,830 1,792,082 Interest expense (4,049) — — — (432,773) (83,652) — — — (520,474) Loss on disposal <strong>of</strong> capital assets (146,928) (3,640) (1) (7,828) (1) (68,929) (3,996) — (80,975) (312,298) Other 536,499 578,840 64,409 39,513 204,923 (66,277) 9,877 — — 1,367,784 Total nonoperating revenues 1,025,799 929,579 326,234 105,730 (130,631) (218,288) 7,396 8,420 272,855 2,327,094 Income (loss) before capital contributions and transfers 1,002,784 3,277,742 (1,403,203) (853,054) (1,467,257) 1,097,707 (943,188) (20,484) (1,095,735) (404,688) Transfers in 236,993 — 3,713,585 254,782 48,000 14,190 307,083 — 3,669,878 8,244,511 Transfers out (1,450,150) (690,520) (17,200) — — (1,865,331) — — (4,669,194) (8,692,395) Change in net assets (210,373) 2,587,222 2,293,182 (598,272) (1,419,257) (753,434) (636,105) (20,484) (2,095,051) (852,572) Total net assets (deficit) at beginning <strong>of</strong> year 39,312,379 4,472,823 13,588,769 5,493,606 1,100,209 5,936,564 (1,771,573) 268,661 20,986,443 89,387,881 Total net assets (deficit) at end <strong>of</strong> year $ 39,102,006 7,060,045 15,881,951 4,895,334 (319,048) 5,183,130 (2,407,678) 248,177 18,891,392 88,535,309
CITY OF SANTA MONICA, CALIFORNIA Statement <strong>of</strong> Cash Flows Nonmajor Enterprise Funds For the fiscal year ended June 30, 2009 127 Total Solid nonmajor Waste Civic Stormwater Special Parking enterprise Water Management Pier Auditorium Airport Management Cemetery Aviation Authority funds Cash flows from operating activities: Cash received from customers $ 15,935,816 21,441,396 3,536,886 2,753,229 4,018,256 1,899,819 1,034,730 — 149,200 50,769,332 Cash payments for materials and services (10,267,058) (10,897,848) (2,449,241) (1,270,366) (3,681,727) (287,527) (1,189,441) — (1,350,187) (31,393,395) Cash payments to employees for services (4,856,071) (8,045,112) (1,658,337) (2,390,970) (1,214,752) — (694,155) — (600) (18,859,997) Other revenue received 536,499 578,840 64,409 39,513 204,923 (66,277) 9,877 — — 1,367,784 Net cash provided by (used in) operating activities 1,349,186 3,077,276 (506,283) (868,594) (673,300) 1,546,015 (838,989) — (1,201,587) 1,883,724 Cash flows from noncapital financing activities: Repayment <strong>of</strong> advances made to other funds — — — — 520,298 — — — — 520,298 Advances from other funds — — — — — 1,258,489 340,773 — — 1,599,262 Transfers in 236,993 — 3,713,585 254,782 48,000 14,190 307,083 — 3,669,878 8,244,511 Transfers out (1,450,150) (690,520) (17,200) — — (1,865,331) — — (4,669,194) (8,692,395) Net cash provided by (used in) noncapital financing activities (1,213,157) (690,520) 3,696,385 254,782 568,298 (592,652) 647,856 — (999,316) 1,671,676 Cash flows from capital and related financing activities: Acquisition and construction <strong>of</strong> capital assets (52,872) (41,010) (2,399,358) (265,367) — (336,431) (43,310) — — (3,138,348) Proceeds from the sale <strong>of</strong> capital assets — — — 1,016 1 — 23 — 203,001 204,041 Reduction in long-term obligations — — — — (22,217) (237,613) — — — (259,830) Payments due to other goverments — — — — — (534,129) — — — (534,129) Interest paid on long-term obligations (4,049) — — — (432,773) (85,711) — — — (522,533) Net cash (used in) capital and related financing (56,921) (41,010) (2,399,358) (264,351) (454,989) (1,193,884) (43,287) — 203,001 (4,250,799) Cash flows from investing activities: Interest on investments 703,973 381,553 299,519 92,334 111,574 570 3,824 9,281 420,534 2,023,162 Net cash provided by investing activities 703,973 381,553 299,519 92,334 111,574 570 3,824 9,281 420,534 2,023,162 Net increase (decrease) in cash and cash equivalents 783,081 2,727,299 1,090,263 (785,829) (448,417) (239,951) (230,596) 9,281 (1,577,368) 1,327,763 Cash and cash equivalents at beginning <strong>of</strong> year 17,929,318 8,246,197 7,347,930 2,566,147 3,053,156 321,875 230,596 237,302 11,641,653 51,574,174 Cash and cash equivalents at end <strong>of</strong> year $ 18,712,399 10,973,496 8,438,193 1,780,318 2,604,739 81,924 — 246,583 10,064,285 52,901,937 Cash and investments $ 17,496,845 4,062,138 8,177,967 1,628,465 — — — 246,583 9,764,285 41,376,283 Restricted cash and investments 1,215,554 6,911,358 260,226 151,853 2,604,739 81,924 — — 300,000 11,525,654 Total cash and cash equivalents $ 18,712,399 10,973,496 8,438,193 1,780,318 2,604,739 81,924 — 246,583 10,064,285 52,901,937 (Continued)
- Page 1:
Comprehensive Annual Financial Repo
- Page 5 and 6:
CITY OF SANTA MONICA, CALIFORNIA Co
- Page 7:
THIS PAGE INTENTIONALLY LEFT BLANK.
- Page 10 and 11:
amount of borrowed property taxes i
- Page 12 and 13:
five-year forecasts, and an underst
- Page 14 and 15:
Cash Management Policies and Practi
- Page 16 and 17:
OFFICIALS OF THE CITY OF SANTA MONI
- Page 18 and 19:
Certificate of Achievement for Exce
- Page 23 and 24:
CITY OF SANTA MONICA, CALIFORNIA Ma
- Page 25 and 26:
CITY OF SANTA MONICA, CALIFORNIA Ma
- Page 27 and 28:
CITY OF SANTA MONICA, CALIFORNIA Ma
- Page 29 and 30:
CITY OF SANTA MONICA, CALIFORNIA Ma
- Page 31 and 32:
CITY OF SANTA MONICA, CALIFORNIA Ma
- Page 33 and 34:
CITY OF SANTA MONICA, CALIFORNIA Ma
- Page 36 and 37:
CITY OF SANTA MONICA, CALIFORNIA St
- Page 38 and 39:
CITY OF SANTA MONICA, CALIFORNIA Ma
- Page 40 and 41:
CITY OF SANTA MONICA, CALIFORNIA St
- Page 42 and 43:
CITY OF SANTA MONICA, CALIFORNIA St
- Page 44 and 45:
CITY OF SANTA MONICA, CALIFORNIA St
- Page 46 and 47:
CITY OF SANTA MONICA, CALIFORNIA St
- Page 48 and 49:
CITY OF SANTA MONICA, CALIFORNIA Pr
- Page 50 and 51:
CITY OF SANTA MONICA, CALIFORNIA St
- Page 52 and 53:
CITY OF SANTA MONICA, CALIFORNIA St
- Page 54 and 55:
CITY OF SANTA MONICA, CALIFORNIA Fi
- Page 56 and 57:
CITY OF SANTA MONICA, CALIFORNIA No
- Page 58 and 59:
CITY OF SANTA MONICA, CALIFORNIA No
- Page 60 and 61:
CITY OF SANTA MONICA, CALIFORNIA No
- Page 62 and 63:
CITY OF SANTA MONICA, CALIFORNIA No
- Page 64 and 65:
CITY OF SANTA MONICA, CALIFORNIA No
- Page 66 and 67:
CITY OF SANTA MONICA, CALIFORNIA No
- Page 68 and 69:
CITY OF SANTA MONICA, CALIFORNIA No
- Page 70 and 71:
CITY OF SANTA MONICA, CALIFORNIA No
- Page 72 and 73:
CITY OF SANTA MONICA, CALIFORNIA No
- Page 74 and 75:
CITY OF SANTA MONICA, CALIFORNIA No
- Page 76 and 77:
CITY OF SANTA MONICA, CALIFORNIA No
- Page 78 and 79:
CITY OF SANTA MONICA, CALIFORNIA No
- Page 80 and 81:
CITY OF SANTA MONICA, CALIFORNIA No
- Page 82 and 83:
CITY OF SANTA MONICA, CALIFORNIA No
- Page 84 and 85:
CITY OF SANTA MONICA, CALIFORNIA No
- Page 86 and 87:
CITY OF SANTA MONICA, CALIFORNIA No
- Page 88 and 89:
CITY OF SANTA MONICA, CALIFORNIA No
- Page 90 and 91:
CITY OF SANTA MONICA, CALIFORNIA No
- Page 92 and 93:
CITY OF SANTA MONICA, CALIFORNIA No
- Page 94 and 95:
CITY OF SANTA MONICA, CALIFORNIA No
- Page 96 and 97:
CITY OF SANTA MONICA, CALIFORNIA No
- Page 98 and 99: CITY OF SANTA MONICA, CALIFORNIA No
- Page 100 and 101: CITY OF SANTA MONICA, CALIFORNIA No
- Page 102 and 103: CITY OF SANTA MONICA, CALIFORNIA No
- Page 104 and 105: CITY OF SANTA MONICA, CALIFORNIA No
- Page 106 and 107: CITY OF SANTA MONICA, CALIFORNIA No
- Page 108 and 109: CITY OF SANTA MONICA, CALIFORNIA No
- Page 110 and 111: City of Santa Monica, California Ye
- Page 112 and 113: CITY OF SANTA MONICA, CALIFORNIA Ca
- Page 114 and 115: CITY OF SANTA MONICA, CALIFORNIA Co
- Page 116 and 117: CITY OF SANTA MONICA, CALIFORNIA Co
- Page 118 and 119: CITY OF SANTA MONICA, CALIFORNIA Co
- Page 120 and 121: CITY OF SANTA MONICA, CALIFORNIA Sc
- Page 122 and 123: CITY OF SANTA MONICA, CALIFORNIA Sc
- Page 124 and 125: CITY OF SANTA MONICA, CALIFORNIA Sc
- Page 126 and 127: CITY OF SANTA MONICA, CALIFORNIA Sc
- Page 128 and 129: CITY OF SANTA MONICA, CALIFORNIA Sc
- Page 130 and 131: CITY OF SANTA MONICA, CALIFORNIA Sc
- Page 132 and 133: CITY OF SANTA MONICA, CALIFORNIA Co
- Page 134 and 135: CITY OF SANTA MONICA, CALIFORNIA Sc
- Page 136 and 137: CITY OF SANTA MONICA, CALIFORNIA Sc
- Page 138 and 139: CITY OF SANTA MONICA, CALIFORNIA Sc
- Page 140 and 141: CITY OF SANTA MONICA, CALIFORNIA Co
- Page 142 and 143: CITY OF SANTA MONICA, CALIFORNIA Co
- Page 144 and 145: THIS PAGE INTENTIONALLY LEFT BLANK
- Page 146 and 147: CITY OF SANTA MONICA, CALIFORNIA St
- Page 150 and 151: CITY OF SANTA MONICA, CALIFORNIA St
- Page 152 and 153: CITY OF SANTA MONICA, CALIFORNIA St
- Page 154 and 155: CITY OF SANTA MONICA, CALIFORNIA St
- Page 156 and 157: CITY OF SANTA MONICA, CALIFORNIA Co
- Page 158: THIS PAGE INTENTIONALLY LEFT BLANK
- Page 161 and 162: CITY OF SANTA MONICA, CALIFORNIA Fo
- Page 163 and 164: CITY OF SANTA MONICA, CALIFORNIA Ch
- Page 165 and 166: CITY OF SANTA MONICA, CALIFORNIA Ch
- Page 167 and 168: CITY OF SANTA MONICA, CALIFORNIA Ch
- Page 169 and 170: CITY OF SANTA MONICA, CALIFORNIA Ge
- Page 171 and 172: CITY OF SANTA MONICA, CALIFORNIA Di
- Page 173 and 174: CITY OF SANTA MONICA, CALIFORNIA Pr
- Page 175 and 176: CITY OF SANTA MONICA, CALIFORNIA Ra
- Page 177 and 178: CITY OF SANTA MONICA, CALIFORNIA Di
- Page 179 and 180: CITY OF SANTA MONICA, CALIFORNIA Wa
- Page 181 and 182: CITY OF SANTA MONICA, CALIFORNIA Re
- Page 183 and 184: CITY OF SANTA MONICA, CALIFORNIA Pr
- Page 185 and 186: CITY OF SANTA MONICA, CALIFORNIA Op
- Page 187: THIS PAGE INTENTIONALLY LEFT BLANK