

Comprehensive Annual Financial Report - City of Santa Monica
Comprehensive Annual Financial Report - City of Santa Monica
Comprehensive Annual Financial Report - City of Santa Monica

You also want an ePaper? Increase the reach of your titles
YUMPU automatically turns print PDFs into web optimized ePapers that Google loves.
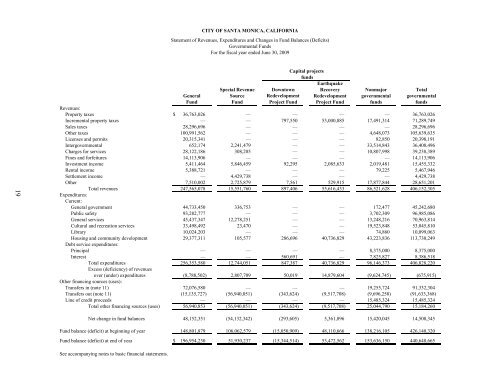
CITY OF SANTA MONICA, CALIFORNIA<br />
Statement <strong>of</strong> Revenues, Expenditures and Changes in Fund Balances (Deficits)<br />
Governmental Funds<br />
For the fiscal year ended June 30, 2009<br />
19<br />
Capital projects<br />
funds<br />
Earthquake<br />
Special Revenue Downtown Recovery Nonmajor Total<br />
General Source Redevelopment Redevelopment governmental governmental<br />
Fund Fund Project Fund Project Fund funds funds<br />
Revenues:<br />
Property taxes $ 36,763,026<br />
— — — — 36,763,026<br />
Incremental property taxes — — 797,550 53,000,885 17,491,314 71,289,749<br />
Sales taxes 28,296,696 — — — — 28,296,696<br />
Other taxes 100,991,562 — — — 4,648,073 105,639,635<br />
Licenses and permits 20,315,341 — — — 82,850 20,398,191<br />
Intergovernmental 652,174 2,241,479 — — 33,514,843 36,408,496<br />
Charges for services 28,122,186 308,205 — — 10,807,998 39,238,389<br />
Fines and forfeitures 14,113,906 — — — — 14,113,906<br />
Investment income 5,411,464 5,846,459 92,295 2,085,633 2,019,481 15,455,332<br />
Rental income 5,388,721 — — — 79,225 5,467,946<br />
Settlement income — 4,429,738 — — — 4,429,738<br />
Other 7,510,002 2,725,879 7,561 529,915 17,877,844 28,651,201<br />
Total revenues 247,565,078 15,551,760 897,406 55,616,433 86,521,628 406,152,305<br />
Expenditures:<br />
Current:<br />
General government 44,733,450 336,753 — — 172,477 45,242,680<br />
Public safety 93,282,777 — — — 3,702,309 96,985,086<br />
General services 45,437,347 12,278,251 — — 13,248,216 70,963,814<br />
Cultural and recreation services 33,498,492 23,470 — — 19,523,848 53,045,810<br />
Library 10,024,203 — — — 74,860 10,099,063<br />
Housing and community development 29,377,311 105,577 286,696 40,736,829 43,223,836 113,730,249<br />
Debt service expenditures:<br />
Principal — — — — 8,375,000 8,375,000<br />
Interest — — 560,691 — 7,825,827 8,386,518<br />
Total expenditures 256,353,580 12,744,051 847,387 40,736,829 96,146,373 406,828,220<br />
Excess (deficiency) <strong>of</strong> revenues<br />
over (under) expenditures (8,788,502) 2,807,709 50,019 14,879,604 (9,624,745) (675,915)<br />
Other financing sources (uses):<br />
Transfers in (note 11) 72,076,580 — — — 19,255,724 91,332,304<br />
Transfers out (note 11) (15,135,727) (56,940,051) (343,624) (9,517,708) (9,696,258) (91,633,368)<br />
Line <strong>of</strong> credit proceeds — — — — 15,485,324 15,485,324<br />
Total other financing sources (uses) 56,940,853 (56,940,051) (343,624) (9,517,708) 25,044,790 15,184,260<br />
Net change in fund balances 48,152,351 (54,132,342) (293,605) 5,361,896 15,420,045 14,508,345<br />
Fund balance (deficit) at beginning <strong>of</strong> year 148,801,879 106,062,579 (15,050,909) 48,110,666 138,216,105 426,140,320<br />
Fund balance (deficit) at end <strong>of</strong> year $ 196,954,230 51,930,237 (15,344,514) 53,472,562 153,636,150 440,648,665<br />
See accompanying notes to basic financial statements.


