

Comprehensive Annual Financial Report - City of Santa Monica
Comprehensive Annual Financial Report - City of Santa Monica
Comprehensive Annual Financial Report - City of Santa Monica

You also want an ePaper? Increase the reach of your titles
YUMPU automatically turns print PDFs into web optimized ePapers that Google loves.
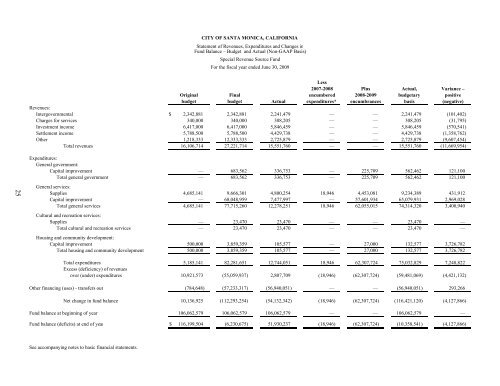
CITY OF SANTA MONICA, CALIFORNIA<br />
Statement <strong>of</strong> Revenues, Expenditures and Changes in<br />
Fund Balance – Budget and Actual (Non-GAAP Basis)<br />
Special Revenue Source Fund<br />
For the fiscal year ended June 30, 2009<br />
Less<br />
2007-2008 Plus Actual, Variance –<br />
Original Final encumbered 2008-2009 budgetary positive<br />
budget budget Actual expenditures* encumbrances basis (negative)<br />
Revenues:<br />
Intergovernmental $ 2,342,881 2,342,881 2,241,479 — — 2,241,479 (101,402)<br />
Charges for services 340,000 340,000 308,205 — — 308,205 (31,795)<br />
Investment income 6,417,000 6,417,000 5,846,459 — — 5,846,459 (570,541)<br />
Settlement income 5,788,500 5,788,500 4,429,738 — — 4,429,738 (1,358,762)<br />
Other 1,218,333 12,333,333 2,725,879 — — 2,725,879 (9,607,454)<br />
Total revenues 16,106,714 27,221,714 15,551,760 — — 15,551,760 (11,669,954)<br />
Expenditures:<br />
General government:<br />
Capital improvement — 683,562 336,753 — 225,709 562,462 121,100<br />
Total general government — 683,562 336,753 — 225,709 562,462 121,100<br />
25<br />
General services:<br />
Supplies 4,685,141 9,666,301 4,800,254 18,946 4,453,081 9,234,389 431,912<br />
Capital improvement — 68,048,959 7,477,997 — 57,601,934 65,079,931 2,969,028<br />
Total general services 4,685,141 77,715,260 12,278,251 18,946 62,055,015 74,314,320 3,400,940<br />
Cultural and recreation services:<br />
Supplies — 23,470 23,470 — — 23,470 —<br />
Total cultural and recreation services — 23,470 23,470 — — 23,470 —<br />
Housing and community development:<br />
Capital improvement 500,000 3,859,359 105,577 — 27,000 132,577 3,726,782<br />
Total housing and community development 500,000 3,859,359 105,577 — 27,000 132,577 3,726,782<br />
Total expenditures 5,185,141 82,281,651 12,744,051 18,946 62,307,724 75,032,829 7,248,822<br />
Excess (deficiency) <strong>of</strong> revenues<br />
over (under) expenditures 10,921,573 (55,059,937) 2,807,709 (18,946) (62,307,724) (59,481,069) (4,421,132)<br />
Other financing (uses) - transfers out (784,648) (57,233,317) (56,940,051) — — (56,940,051) 293,266<br />
Net change in fund balance 10,136,925 (112,293,254) (54,132,342) (18,946) (62,307,724) (116,421,120) (4,127,866)<br />
Fund balance at beginning <strong>of</strong> year 106,062,579 106,062,579 106,062,579 — — 106,062,579 —<br />
Fund balance (deficits) at end <strong>of</strong> year $ 116,199,504 (6,230,675) 51,930,237 (18,946) (62,307,724) (10,358,541) (4,127,866)<br />
See accompanying notes to basic financial statements.


