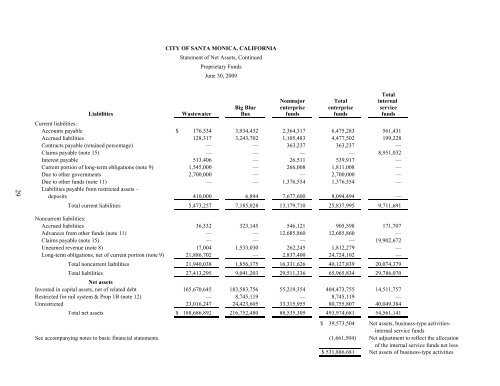
CITY OF SANTA MONICA, CALIFORNIA Statement <strong>of</strong> Net Assets, Continued Proprietary Funds June 30, 2009 29 Total Nonmajor Total internal Big Blue enterprise enterprise service Liabilities Wastewater Bus funds funds funds Current liabilities: Accounts payable $ 176,534 3,934,432 2,364,317 6,475,283 561,431 Accrued liabilities 128,317 3,243,702 1,105,483 4,477,502 199,228 Contracts payable (retained percentage) — — 363,237 363,237 — Claims payable (note 15) — — — — 8,951,032 Interest payable 513,406 — 26,511 539,917 — Current portion <strong>of</strong> long-term obligations (note 9) 1,545,000 — 266,008 1,811,008 — Due to other governments 2,700,000 — — 2,700,000 — Due to other funds (note 11) — — 1,376,554 1,376,554 — Liabilities payable from restricted assets – deposits 410,000 6,894 7,677,600 8,094,494 — Total current liabilities 5,473,257 7,185,028 13,179,710 25,837,995 9,711,691 Noncurrent liabilities: Accrued liabilities 36,332 323,145 546,121 905,598 171,707 Advances from other funds (note 11) — — 12,685,860 12,685,860 — Claims payable (note 15) — — — — 19,902,672 Unearned revenue (note 8) 17,004 1,533,030 262,245 1,812,279 — Long-term obligations, net <strong>of</strong> current portion (note 9) 21,886,702 — 2,837,400 24,724,102 — Total noncurrent liabilities 21,940,038 1,856,175 16,331,626 40,127,839 20,074,379 Total liabilities 27,413,295 9,041,203 29,511,336 65,965,834 29,786,070 Net assets Invested in capital assets, net <strong>of</strong> related debt 165,670,645 183,583,756 55,219,354 404,473,755 14,511,757 Restricted for rail system & Prop 1B (note 12) — 8,745,119 — 8,745,119 — Unrestricted 23,016,247 24,423,605 33,315,955 80,755,807 40,049,384 Total net assets $ 188,686,892 216,752,480 88,535,309 493,974,681 54,561,141 $ 39,573,504 Net assets, business-type activitiesinternal service funds See accompanying notes to basic financial statements. (1,661,504) Net adjustment to reflect the allocation <strong>of</strong> the internal service funds net loss $ 531,886,681 Net assets <strong>of</strong> business-type activities
CITY OF SANTA MONICA, CALIFORNIA Statement <strong>of</strong> Revenues, Expenses and Changes in Fund Net Assets Proprietary Funds For the fiscal year ended June 30, 2009 30 Total Nonmajor Total internal Big Blue enterprise enterprise service Wastewater Bus funds funds funds Operating revenues - charges for services $ 13,751,588 14,391,300 50,933,042 79,075,930 26,073,590 Operating expenses: Personnel services 1,970,012 34,697,975 18,958,109 55,626,096 3,896,852 Administrative indirect 562,612 3,176,753 3,513,662 7,253,027 507,955 Contractual services 2,426,223 3,434,835 7,334,404 13,195,462 55,490 Repairs and maintenance 1,013,385 1,180,646 3,511,022 5,705,053 1,825,465 Materials and supplies 877,147 6,233,283 8,139,097 15,249,527 2,374,745 Utilities 14,729 423,084 1,131,176 1,568,989 82,708 Water purchases — — 3,501,575 3,501,575 — Casualty, property and liability costs 168,800 1,880,274 1,093,500 3,142,574 52,700 Claims expense, net <strong>of</strong> claims reserve adjustments — — — — 11,720,600 Insurance and bonds — — — — 3,058,131 Miscellaneous fees and costs — — — — 1,006,447 Administrative fees and costs — — — — 219,762 Depreciation 6,130,488 17,351,484 2,911,260 26,393,232 2,812,617 Other 5,273,273 532,901 3,571,019 9,377,193 — Total operating expenses 18,436,669 68,911,235 53,664,824 141,012,728 27,613,472 Operating income (loss) (4,685,081) (54,519,935) (2,731,782) (61,936,798) (1,539,882) Nonoperating revenues (expenses): Sales tax proceeds — 34,203,607 — 34,203,607 — Investment income 862,458 574,709 1,792,082 3,229,249 2,294,526 Interest expense (1,214,959) — (520,474) (1,735,433) — Gain (loss) on disposal <strong>of</strong> capital assets — (9,203) (312,298) (321,501) 6,902 Other 339,144 2,408,942 1,367,784 4,115,870 73,607 Total nonoperating revenues (expenses) (13,357) 37,178,055 2,327,094 39,491,792 2,375,035 Income(loss) before capital contributions and transfers (4,698,438) (17,341,880) (404,688) (22,445,006) 835,153 Capital contributions — 53,209,039 — 53,209,039 — Transfers in (note 11) 7,237,304 538,597 8,244,511 16,020,412 691,800 Transfers out (note 11) (833,700) (387,300) (8,692,395) (9,913,395) (691,800) Change in net assets 1,705,166 36,018,456 (852,572) 36,871,050 835,153 Net assets at beginning <strong>of</strong> year 186,981,726 180,734,024 89,387,881 457,103,631 53,725,988 Net assets at end <strong>of</strong> year $ 188,686,892 216,752,480 88,535,309 493,974,681 54,561,141 $ 36,871,050 Change in net assets (974,363) Net adjustment to reflect the consolidation <strong>of</strong> internal service fund activities related to See accompanying notes to basic financial statements. enterprise funds $ 35,896,687 Change in net assets <strong>of</strong> business-type activities
- Page 1: Comprehensive Annual Financial Repo
- Page 5 and 6: CITY OF SANTA MONICA, CALIFORNIA Co
- Page 7: THIS PAGE INTENTIONALLY LEFT BLANK.
- Page 10 and 11: amount of borrowed property taxes i
- Page 12 and 13: five-year forecasts, and an underst
- Page 14 and 15: Cash Management Policies and Practi
- Page 16 and 17: OFFICIALS OF THE CITY OF SANTA MONI
- Page 18 and 19: Certificate of Achievement for Exce
- Page 23 and 24: CITY OF SANTA MONICA, CALIFORNIA Ma
- Page 25 and 26: CITY OF SANTA MONICA, CALIFORNIA Ma
- Page 27 and 28: CITY OF SANTA MONICA, CALIFORNIA Ma
- Page 29 and 30: CITY OF SANTA MONICA, CALIFORNIA Ma
- Page 31 and 32: CITY OF SANTA MONICA, CALIFORNIA Ma
- Page 33 and 34: CITY OF SANTA MONICA, CALIFORNIA Ma
- Page 36 and 37: CITY OF SANTA MONICA, CALIFORNIA St
- Page 38 and 39: CITY OF SANTA MONICA, CALIFORNIA Ma
- Page 40 and 41: CITY OF SANTA MONICA, CALIFORNIA St
- Page 42 and 43: CITY OF SANTA MONICA, CALIFORNIA St
- Page 44 and 45: CITY OF SANTA MONICA, CALIFORNIA St
- Page 46 and 47: CITY OF SANTA MONICA, CALIFORNIA St
- Page 48 and 49: CITY OF SANTA MONICA, CALIFORNIA Pr
- Page 52 and 53: CITY OF SANTA MONICA, CALIFORNIA St
- Page 54 and 55: CITY OF SANTA MONICA, CALIFORNIA Fi
- Page 56 and 57: CITY OF SANTA MONICA, CALIFORNIA No
- Page 58 and 59: CITY OF SANTA MONICA, CALIFORNIA No
- Page 60 and 61: CITY OF SANTA MONICA, CALIFORNIA No
- Page 62 and 63: CITY OF SANTA MONICA, CALIFORNIA No
- Page 64 and 65: CITY OF SANTA MONICA, CALIFORNIA No
- Page 66 and 67: CITY OF SANTA MONICA, CALIFORNIA No
- Page 68 and 69: CITY OF SANTA MONICA, CALIFORNIA No
- Page 70 and 71: CITY OF SANTA MONICA, CALIFORNIA No
- Page 72 and 73: CITY OF SANTA MONICA, CALIFORNIA No
- Page 74 and 75: CITY OF SANTA MONICA, CALIFORNIA No
- Page 76 and 77: CITY OF SANTA MONICA, CALIFORNIA No
- Page 78 and 79: CITY OF SANTA MONICA, CALIFORNIA No
- Page 80 and 81: CITY OF SANTA MONICA, CALIFORNIA No
- Page 82 and 83: CITY OF SANTA MONICA, CALIFORNIA No
- Page 84 and 85: CITY OF SANTA MONICA, CALIFORNIA No
- Page 86 and 87: CITY OF SANTA MONICA, CALIFORNIA No
- Page 88 and 89: CITY OF SANTA MONICA, CALIFORNIA No
- Page 90 and 91: CITY OF SANTA MONICA, CALIFORNIA No
- Page 92 and 93: CITY OF SANTA MONICA, CALIFORNIA No
- Page 94 and 95: CITY OF SANTA MONICA, CALIFORNIA No
- Page 96 and 97: CITY OF SANTA MONICA, CALIFORNIA No
- Page 98 and 99: CITY OF SANTA MONICA, CALIFORNIA No
- Page 100 and 101:
CITY OF SANTA MONICA, CALIFORNIA No
- Page 102 and 103:
CITY OF SANTA MONICA, CALIFORNIA No
- Page 104 and 105:
CITY OF SANTA MONICA, CALIFORNIA No
- Page 106 and 107:
CITY OF SANTA MONICA, CALIFORNIA No
- Page 108 and 109:
CITY OF SANTA MONICA, CALIFORNIA No
- Page 110 and 111:
City of Santa Monica, California Ye
- Page 112 and 113:
CITY OF SANTA MONICA, CALIFORNIA Ca
- Page 114 and 115:
CITY OF SANTA MONICA, CALIFORNIA Co
- Page 116 and 117:
CITY OF SANTA MONICA, CALIFORNIA Co
- Page 118 and 119:
CITY OF SANTA MONICA, CALIFORNIA Co
- Page 120 and 121:
CITY OF SANTA MONICA, CALIFORNIA Sc
- Page 122 and 123:
CITY OF SANTA MONICA, CALIFORNIA Sc
- Page 124 and 125:
CITY OF SANTA MONICA, CALIFORNIA Sc
- Page 126 and 127:
CITY OF SANTA MONICA, CALIFORNIA Sc
- Page 128 and 129:
CITY OF SANTA MONICA, CALIFORNIA Sc
- Page 130 and 131:
CITY OF SANTA MONICA, CALIFORNIA Sc
- Page 132 and 133:
CITY OF SANTA MONICA, CALIFORNIA Co
- Page 134 and 135:
CITY OF SANTA MONICA, CALIFORNIA Sc
- Page 136 and 137:
CITY OF SANTA MONICA, CALIFORNIA Sc
- Page 138 and 139:
CITY OF SANTA MONICA, CALIFORNIA Sc
- Page 140 and 141:
CITY OF SANTA MONICA, CALIFORNIA Co
- Page 142 and 143:
CITY OF SANTA MONICA, CALIFORNIA Co
- Page 144 and 145:
THIS PAGE INTENTIONALLY LEFT BLANK
- Page 146 and 147:
CITY OF SANTA MONICA, CALIFORNIA St
- Page 148 and 149:
CITY OF SANTA MONICA, CALIFORNIA St
- Page 150 and 151:
CITY OF SANTA MONICA, CALIFORNIA St
- Page 152 and 153:
CITY OF SANTA MONICA, CALIFORNIA St
- Page 154 and 155:
CITY OF SANTA MONICA, CALIFORNIA St
- Page 156 and 157:
CITY OF SANTA MONICA, CALIFORNIA Co
- Page 158:
THIS PAGE INTENTIONALLY LEFT BLANK
- Page 161 and 162:
CITY OF SANTA MONICA, CALIFORNIA Fo
- Page 163 and 164:
CITY OF SANTA MONICA, CALIFORNIA Ch
- Page 165 and 166:
CITY OF SANTA MONICA, CALIFORNIA Ch
- Page 167 and 168:
CITY OF SANTA MONICA, CALIFORNIA Ch
- Page 169 and 170:
CITY OF SANTA MONICA, CALIFORNIA Ge
- Page 171 and 172:
CITY OF SANTA MONICA, CALIFORNIA Di
- Page 173 and 174:
CITY OF SANTA MONICA, CALIFORNIA Pr
- Page 175 and 176:
CITY OF SANTA MONICA, CALIFORNIA Ra
- Page 177 and 178:
CITY OF SANTA MONICA, CALIFORNIA Di
- Page 179 and 180:
CITY OF SANTA MONICA, CALIFORNIA Wa
- Page 181 and 182:
CITY OF SANTA MONICA, CALIFORNIA Re
- Page 183 and 184:
CITY OF SANTA MONICA, CALIFORNIA Pr
- Page 185 and 186:
CITY OF SANTA MONICA, CALIFORNIA Op
- Page 187:
THIS PAGE INTENTIONALLY LEFT BLANK