TAV IT
TAV IT
TAV IT

You also want an ePaper? Increase the reach of your titles
YUMPU automatically turns print PDFs into web optimized ePapers that Google loves.
194<br />
<strong>TAV</strong> Airports Holding Annual Report 2008<br />
<strong>TAV</strong> AIRPORTS HOLDING AND <strong>IT</strong>S SUBSIDIARIES<br />
NOTES TO THE CONSOLIDATED FINANCIAL STATEMENTS<br />
AS AT AND FOR THE YEAR ENDED 31 DECEMBER 2008<br />
(Amounts expressed in Euro unless otherwise stated)<br />
Cash flow sensitivity analysis for variable rate instruments:<br />
Based on the Group’s current borrowing profile, a 50 basis points increase in Euribor or Libor would have resulted in additional annual<br />
interest expense of approximately EUR 1 million on the Group’s variable rate debt when ignoring effect of derivative financial<br />
instruments. EUR 0.6 million of the exposure is hedged through IRS contracts. Therefore, the net exposure on income statement<br />
would be EUR 0.4 million. A 50 basis points increase in Euribor or Libor would have resulted a decrease in hedging reserve in equity<br />
approximately by EUR 21 million.<br />
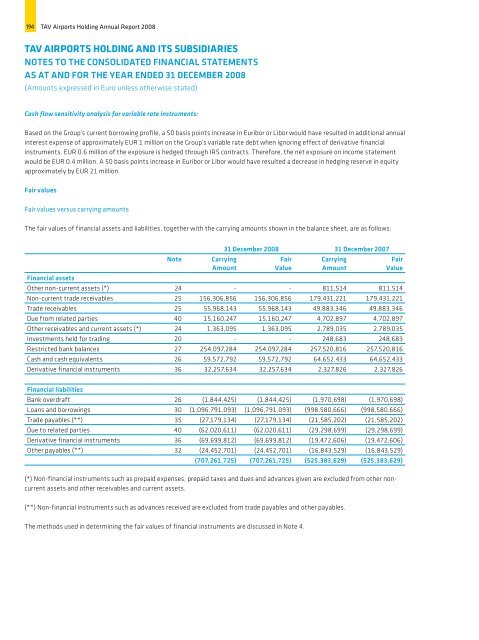
Fair values<br />
Fair values versus carrying amounts<br />
The fair values of financial assets and liabilities, together with the carrying amounts shown in the balance sheet, are as follows:<br />
Note<br />
31 December 2008 31 December 2007<br />
Carrying<br />
Amount<br />
Fair<br />
Value<br />
Carrying<br />
Amount<br />
Fair<br />
Value<br />
Financial assets<br />
Other non-current assets (*) 24 - - 811,514 811,514<br />
Non-current trade receivables 25 156,306,856 156,306,856 179,431,221 179,431,221<br />
Trade receivables 25 55,968,143 55,968,143 49,883,346 49,883,346<br />
Due from related parties 40 15,160,247 15,160,247 4,702,897 4,702,897<br />
Other receivables and current assets (*) 24 1,363,095 1,363,095 2,789,035 2,789,035<br />
Investments held for trading 20 - - 248,683 248,683<br />
Restricted bank balances 27 254,097,284 254,097,284 257,520,816 257,520,816<br />
Cash and cash equivalents 26 59,572,792 59,572,792 64,652,433 64,652,433<br />
Derivative financial instruments 36 32,257,634 32,257,634 2,327,826 2,327,826<br />
Financial liabilities<br />
Bank overdraft 26 (1,844,425) (1,844,425) (1,970,698) (1,970,698)<br />
Loans and borrowings 30 (1,096,791,093) (1,096,791,093) (998,580,666) (998,580,666)<br />
Trade payables (**) 35 (27,179,134) (27,179,134) (21,585,202) (21,585,202)<br />
Due to related parties 40 (62,020,611) (62,020,611) (29,298,699) (29,298,699)<br />
Derivative financial instruments 36 (69,699,812) (69,699,812) (19,472,606) (19,472,606)<br />
Other payables (**) 32 (24,452,701) (24,452,701) (16,843,529) (16,843,529)<br />
(707,261,725) (707,261,725) (525,383,629) (525,383,629)<br />
(*) Non-financial instruments such as prepaid expenses, prepaid taxes and dues and advances given are excluded from other noncurrent<br />
assets and other receivables and current assets.<br />
(**) Non-financial instruments such as advances received are excluded from trade payables and other payables.<br />
The methods used in determining the fair values of financial instruments are discussed in Note 4.