User Manual - TRS-RenTelco
User Manual - TRS-RenTelco
User Manual - TRS-RenTelco

Create successful ePaper yourself
Turn your PDF publications into a flip-book with our unique Google optimized e-Paper software.
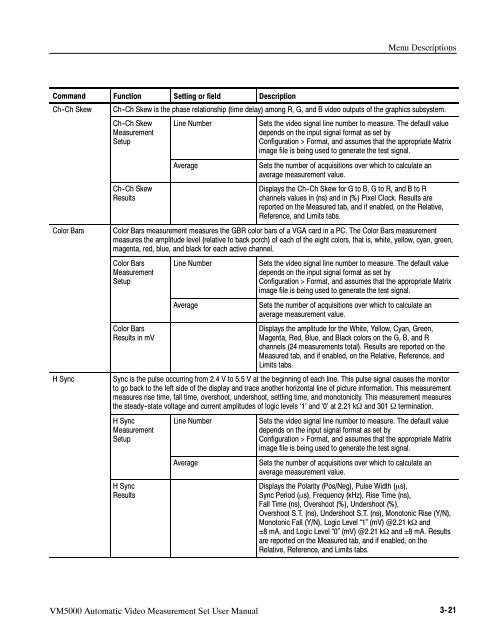
Menu Descriptions<br />
Command<br />
Ch -Ch Skew<br />
Color Bars<br />
H Sync<br />
Function<br />
Setting or field<br />
Description<br />
Ch -Ch Skew is the phase relationship (time delay) among R, G, and B video outputs of the graphics subsystem.<br />
Ch -Ch Skew<br />
Measurement<br />
Setup<br />
Ch -Ch Skew<br />
Results<br />
Line Number<br />
Average<br />
Sets the video signal line number to measure. The default value<br />
depends on the input signal format as set by<br />
Configuration > Format, and assumes that the appropriate Matrix<br />
image file is being used to generate the test signal.<br />
Sets the number of acquisitions over which to calculate an<br />
average measurement value.<br />
Displays the Ch -Ch Skew for G to B, G to R, and B to R<br />
channels values in (ns) and in (%) Pixel Clock. Results are<br />
reported on the Measured tab, and if enabled, on the Relative,<br />
Reference, and Limits tabs.<br />
Color Bars measurement measures the GBR color bars of a VGA card in a PC. The Color Bars measurement<br />
measures the amplitude level (relative to back porch) of each of the eight colors, that is, white, yellow, cyan, green,<br />
magenta, red, blue, and black for each active channel.<br />
Color Bars<br />
Measurement<br />
Setup<br />
Color Bars<br />
Results in mV<br />
Line Number<br />
Average<br />
Sets the video signal line number to measure. The default value<br />
depends on the input signal format as set by<br />
Configuration > Format, and assumes that the appropriate Matrix<br />
image file is being used to generate the test signal.<br />
Sets the number of acquisitions over which to calculate an<br />
average measurement value.<br />
Displays the amplitude for the White, Yellow, Cyan, Green,<br />
Magenta, Red, Blue, and Black colors on the G, B, and R<br />
channels (24 measurements total). Results are reported on the<br />
Measured tab, and if enabled, on the Relative, Reference, and<br />
Limits tabs.<br />
Sync is the pulse occurring from 2.4 V to 5.5 V at the beginning of each line. This pulse signal causes the monitor<br />
to go back to the left side of the display and trace another horizontal line of picture information. This measurement<br />
measures rise time, fall time, overshoot, undershoot, settling time, and monotonicity. This measurement measures<br />
the steady -state voltage and current amplitudes of logic levels ‘1’ and ‘0’ at 2.21 kΩ and 301 Ω termination.<br />
H Sync<br />
Measurement<br />
Setup<br />
H Sync<br />
Results<br />
Line Number<br />
Average<br />
Sets the video signal line number to measure. The default value<br />
depends on the input signal format as set by<br />
Configuration > Format, and assumes that the appropriate Matrix<br />
image file is being used to generate the test signal.<br />
Sets the number of acquisitions over which to calculate an<br />
average measurement value.<br />
Displays the Polarity (Pos/Neg), Pulse Width (μs),<br />
Sync Period (μs), Frequency (kHz), Rise Time (ns),<br />
Fall Time (ns), Overshoot (%), Undershoot (%),<br />
Overshoot S.T. (ns), Undershoot S.T. (ns), Monotonic Rise (Y/N),<br />
Monotonic Fall (Y/N), Logic Level “1” (mV) @2.21 kΩ and<br />
±8 mA, and Logic Level “0” (mV) @2.21 kΩ and ±8 mA. Results<br />
are reported on the Measured tab, and if enabled, on the<br />
Relative, Reference, and Limits tabs.<br />
VM5000 Automatic Video Measurement Set <strong>User</strong> <strong>Manual</strong> 3-21