Form 10-K - Union Pacific
Form 10-K - Union Pacific
Form 10-K - Union Pacific

You also want an ePaper? Increase the reach of your titles
YUMPU automatically turns print PDFs into web optimized ePapers that Google loves.
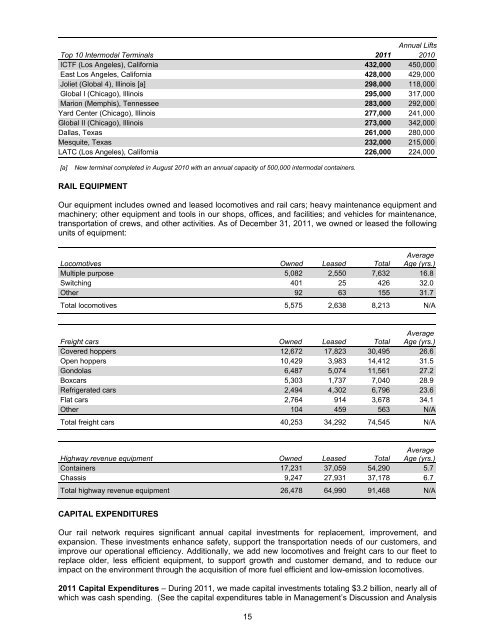
Annual Lifts<br />
Top <strong>10</strong> Intermodal Terminals 2011 20<strong>10</strong><br />
ICTF (Los Angeles), California 432,000 450,000<br />
East Los Angeles, California 428,000 429,000<br />
Joliet (Global 4), Illinois [a] 298,000 118,000<br />
Global I (Chicago), Illinois 295,000 317,000<br />
Marion (Memphis), Tennessee 283,000 292,000<br />
Yard Center (Chicago), Illinois 277,000 241,000<br />
Global II (Chicago), Illinois 273,000 342,000<br />
Dallas, Texas 261,000 280,000<br />
Mesquite, Texas 232,000 215,000<br />
LATC (Los Angeles), California 226,000 224,000<br />
[a]<br />
New terminal completed in August 20<strong>10</strong> with an annual capacity of 500,000 intermodal containers.<br />
RAIL EQUIPMENT<br />
Our equipment includes owned and leased locomotives and rail cars; heavy maintenance equipment and<br />
machinery; other equipment and tools in our shops, offices, and facilities; and vehicles for maintenance,<br />
transportation of crews, and other activities. As of December 31, 2011, we owned or leased the following<br />
units of equipment:<br />
Locomotives Owned Leased Total<br />
Average<br />
Age (yrs.)<br />
Multiple purpose 5,082 2,550 7,632 16.8<br />
Switching 401 25 426 32.0<br />
Other 92 63 155 31.7<br />
Total locomotives 5,575 2,638 8,213 N/A<br />
Freight cars Owned Leased Total<br />
Average<br />
Age (yrs.)<br />
Covered hoppers 12,672 17,823 30,495 26.6<br />
Open hoppers <strong>10</strong>,429 3,983 14,412 31.5<br />
Gondolas 6,487 5,074 11,561 27.2<br />
Boxcars 5,303 1,737 7,040 28.9<br />
Refrigerated cars 2,494 4,302 6,796 23.6<br />
Flat cars 2,764 914 3,678 34.1<br />
Other <strong>10</strong>4 459 563 N/A<br />
Total freight cars 40,253 34,292 74,545 N/A<br />
Highway revenue equipment Owned Leased Total<br />
Average<br />
Age (yrs.)<br />
Containers 17,231 37,059 54,290 5.7<br />
Chassis 9,247 27,931 37,178 6.7<br />
Total highway revenue equipment 26,478 64,990 91,468 N/A<br />
CAPITAL EXPENDITURES<br />
Our rail network requires significant annual capital investments for replacement, improvement, and<br />
expansion. These investments enhance safety, support the transportation needs of our customers, and<br />
improve our operational efficiency. Additionally, we add new locomotives and freight cars to our fleet to<br />
replace older, less efficient equipment, to support growth and customer demand, and to reduce our<br />
impact on the environment through the acquisition of more fuel efficient and low-emission locomotives.<br />
2011 Capital Expenditures – During 2011, we made capital investments totaling $3.2 billion, nearly all of<br />
which was cash spending. (See the capital expenditures table in Management’s Discussion and Analysis<br />
15