Form 10-K - Union Pacific
Form 10-K - Union Pacific
Form 10-K - Union Pacific

Create successful ePaper yourself
Turn your PDF publications into a flip-book with our unique Google optimized e-Paper software.
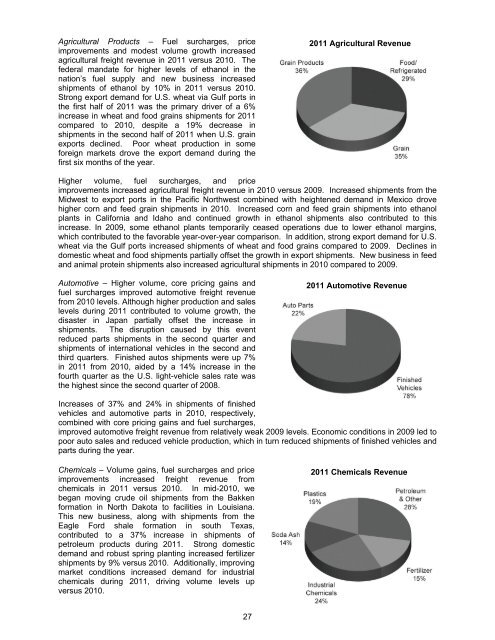
Agricultural Products – Fuel surcharges, price<br />
improvements and modest volume growth increased<br />
agricultural freight revenue in 2011 versus 20<strong>10</strong>. The<br />
federal mandate for higher levels of ethanol in the<br />
nation’s fuel supply and new business increased<br />
shipments of ethanol by <strong>10</strong>% in 2011 versus 20<strong>10</strong>.<br />
Strong export demand for U.S. wheat via Gulf ports in<br />
the first half of 2011 was the primary driver of a 6%<br />
increase in wheat and food grains shipments for 2011<br />
compared to 20<strong>10</strong>, despite a 19% decrease in<br />
shipments in the second half of 2011 when U.S. grain<br />
exports declined. Poor wheat production in some<br />
foreign markets drove the export demand during the<br />
first six months of the year.<br />
2011 Agricultural Revenue<br />
Higher volume, fuel surcharges, and price<br />
improvements increased agricultural freight revenue in 20<strong>10</strong> versus 2009. Increased shipments from the<br />
Midwest to export ports in the <strong>Pacific</strong> Northwest combined with heightened demand in Mexico drove<br />
higher corn and feed grain shipments in 20<strong>10</strong>. Increased corn and feed grain shipments into ethanol<br />
plants in California and Idaho and continued growth in ethanol shipments also contributed to this<br />
increase. In 2009, some ethanol plants temporarily ceased operations due to lower ethanol margins,<br />
which contributed to the favorable year-over-year comparison. In addition, strong export demand for U.S.<br />
wheat via the Gulf ports increased shipments of wheat and food grains compared to 2009. Declines in<br />
domestic wheat and food shipments partially offset the growth in export shipments. New business in feed<br />
and animal protein shipments also increased agricultural shipments in 20<strong>10</strong> compared to 2009.<br />
Automotive – Higher volume, core pricing gains and<br />
fuel surcharges improved automotive freight revenue<br />
from 20<strong>10</strong> levels. Although higher production and sales<br />
levels during 2011 contributed to volume growth, the<br />
disaster in Japan partially offset the increase in<br />
shipments. The disruption caused by this event<br />
reduced parts shipments in the second quarter and<br />
shipments of international vehicles in the second and<br />
third quarters. Finished autos shipments were up 7%<br />
in 2011 from 20<strong>10</strong>, aided by a 14% increase in the<br />
fourth quarter as the U.S. light-vehicle sales rate was<br />
the highest since the second quarter of 2008.<br />
2011 Automotive Revenue<br />
Increases of 37% and 24% in shipments of finished<br />
vehicles and automotive parts in 20<strong>10</strong>, respectively,<br />
combined with core pricing gains and fuel surcharges,<br />
improved automotive freight revenue from relatively weak 2009 levels. Economic conditions in 2009 led to<br />
poor auto sales and reduced vehicle production, which in turn reduced shipments of finished vehicles and<br />
parts during the year.<br />
Chemicals – Volume gains, fuel surcharges and price<br />
improvements increased freight revenue from<br />
chemicals in 2011 versus 20<strong>10</strong>. In mid-20<strong>10</strong>, we<br />
began moving crude oil shipments from the Bakken<br />
formation in North Dakota to facilities in Louisiana.<br />
This new business, along with shipments from the<br />
Eagle Ford shale formation in south Texas,<br />
contributed to a 37% increase in shipments of<br />
petroleum products during 2011. Strong domestic<br />
demand and robust spring planting increased fertilizer<br />
shipments by 9% versus 20<strong>10</strong>. Additionally, improving<br />
market conditions increased demand for industrial<br />
chemicals during 2011, driving volume levels up<br />
versus 20<strong>10</strong>.<br />
2011 Chemicals Revenue<br />
27