Form 10-K - Union Pacific
Form 10-K - Union Pacific
Form 10-K - Union Pacific

You also want an ePaper? Increase the reach of your titles
YUMPU automatically turns print PDFs into web optimized ePapers that Google loves.
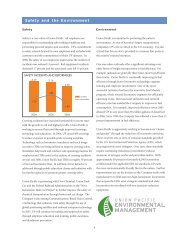
2011, effectively handling the 3% increase in carloads. Maintenance activities and weather disruptions,<br />
combined with higher volume levels, led to a 4% decrease in average train speed in 20<strong>10</strong> compared to a<br />
record set in 2009.<br />
Average Terminal Dwell Time – Average terminal dwell time is the average time that a rail car spends at<br />
our terminals. Lower average terminal dwell time improves asset utilization and service. Average terminal<br />
dwell time increased 3% in 2011 compared to 20<strong>10</strong>. Additional volume, weather challenges, track<br />
replacement programs, and a shift of traffic mix to more manifest shipments, which require additional<br />
terminal processing, all contributed to the increase. Average terminal dwell time increased 2% in 20<strong>10</strong><br />
compared to 2009, driven in part by our network plan to increase the length of numerous trains to improve<br />
overall efficiency, which resulted in higher terminal dwell time for some cars.<br />
Average Rail Car Inventory – Average rail car inventory is the daily average number of rail cars on our<br />
lines, including rail cars in storage. Lower average rail car inventory reduces congestion in our yards and<br />
sidings, which increases train speed, reduces average terminal dwell time, and improves rail car<br />
utilization. Average rail car inventory decreased slightly in 2011 compared to 20<strong>10</strong>, as we continued to<br />
adjust the size of our freight car fleet. Average rail car inventory decreased 3% in 20<strong>10</strong> compared to<br />
2009, while we handled a 13% increase in carloads during the period compared to 2009. We maintained<br />
more freight cars off-line and retired a number of old freight cars, which drove the decrease.<br />
Gross and Revenue Ton-Miles – Gross ton-miles are calculated by multiplying the weight of loaded and<br />
empty freight cars by the number of miles hauled. Revenue ton-miles are calculated by multiplying the<br />
weight of freight by the number of tariff miles. Gross and revenue-ton-miles increased 5% in 2011<br />
compared to 20<strong>10</strong>, driven by a 3% increase in carloads and mix changes to heavier commodity groups,<br />
notably a 5% increase in energy shipments. Gross and revenue-ton-miles increased <strong>10</strong>% and 9%,<br />
respectively, in 20<strong>10</strong> compared to 2009 due to a 13% increase in carloads. Commodity mix changes<br />
(notably automotive shipments) drove the variance in year-over-year growth between gross ton-miles,<br />
revenue ton-miles and carloads.<br />
Operating Ratio – Operating ratio is our operating expenses reflected as a percentage of operating<br />
revenue. Our operating ratio increased 0.1 points to 70.7% in 2011 versus 20<strong>10</strong>. Higher fuel prices,<br />
inflation and weather related costs, partially offset by core pricing gains and productivity initiatives, drove<br />
the increase. Our operating ratio improved 5.5 points to 70.6% in 20<strong>10</strong> and 1.3 points to 76.1% in 2009.<br />
Efficiently leveraging volume increases, core pricing gains, and productivity initiatives drove the<br />
improvement in 20<strong>10</strong> and more than offset the impact of higher fuel prices during the year.<br />
Employees – Employee levels were up 5% in 2011 versus 20<strong>10</strong>, driven by a 3% increase in volume<br />
levels, a higher number of trainmen, engineers, and yard employees receiving training during the year,<br />
and increased work on capital projects. Employee levels were down 1% in 20<strong>10</strong> compared to 2009<br />
despite a 13% increase in volume levels. We leveraged the additional volumes through network<br />
efficiencies and other productivity initiatives. In addition, we successfully managed the growth of our fulltime-equivalent<br />
train and engine force levels at a rate less than half of our carload growth in 20<strong>10</strong>. All<br />
other operating functions and support organizations reduced their full-time-equivalent force levels,<br />
benefiting from continued productivity initiatives.<br />
Customer Satisfaction Index – Our customer satisfaction survey asks customers to rate how satisfied they<br />
are with our performance over the last 12 months on a variety of attributes. A higher score indicates<br />
higher customer satisfaction. We believe that improvement in survey results in 2011 generally reflects<br />
customer recognition of our service quality supported by our capital investment program.<br />
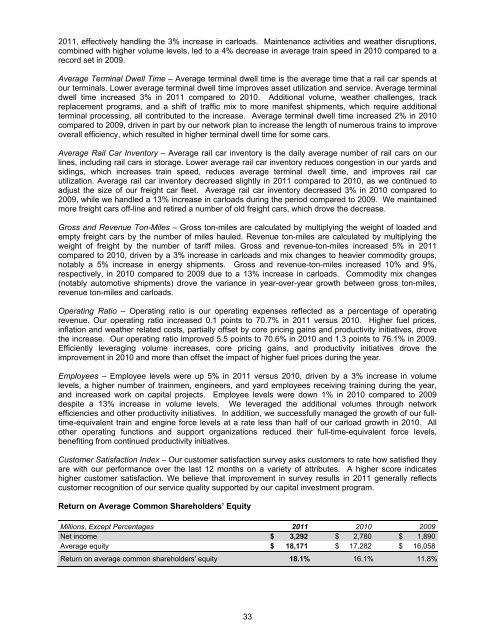
Return on Average Common Shareholders’ Equity<br />
Millions, Except Percentages 2011 20<strong>10</strong> 2009<br />
Net income $ 3,292 $ 2,780 $ 1,890<br />
Average equity $ 18,171 $ 17,282 $ 16,058<br />
Return on average common shareholders' equity 18.1% 16.1% 11.8%<br />
33