Form 10-K - Union Pacific
Form 10-K - Union Pacific
Form 10-K - Union Pacific

Create successful ePaper yourself
Turn your PDF publications into a flip-book with our unique Google optimized e-Paper software.
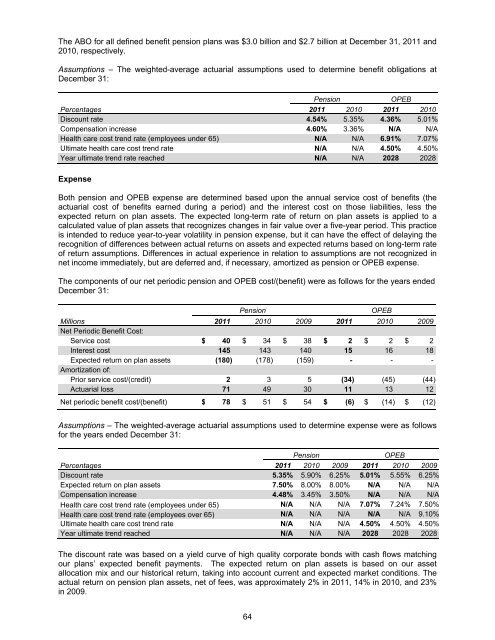
The ABO for all defined benefit pension plans was $3.0 billion and $2.7 billion at December 31, 2011 and<br />
20<strong>10</strong>, respectively.<br />
Assumptions – The weighted-average actuarial assumptions used to determine benefit obligations at<br />
December 31:<br />
Pension<br />
OPEB<br />
Percentages 2011 20<strong>10</strong> 2011 20<strong>10</strong><br />
Discount rate 4.54% 5.35% 4.36% 5.01%<br />
Compensation increase 4.60% 3.36% N/A N/A<br />
Health care cost trend rate (employees under 65) N/A N/A 6.91% 7.07%<br />
Ultimate health care cost trend rate N/A N/A 4.50% 4.50%<br />
Year ultimate trend rate reached N/A N/A 2028 2028<br />
Expense<br />
Both pension and OPEB expense are determined based upon the annual service cost of benefits (the<br />
actuarial cost of benefits earned during a period) and the interest cost on those liabilities, less the<br />
expected return on plan assets. The expected long-term rate of return on plan assets is applied to a<br />
calculated value of plan assets that recognizes changes in fair value over a five-year period. This practice<br />
is intended to reduce year-to-year volatility in pension expense, but it can have the effect of delaying the<br />
recognition of differences between actual returns on assets and expected returns based on long-term rate<br />
of return assumptions. Differences in actual experience in relation to assumptions are not recognized in<br />
net income immediately, but are deferred and, if necessary, amortized as pension or OPEB expense.<br />
The components of our net periodic pension and OPEB cost/(benefit) were as follows for the years ended<br />
December 31:<br />
Pension<br />
OPEB<br />
Millions 2011 20<strong>10</strong> 2009 2011 20<strong>10</strong> 2009<br />
Net Periodic Benefit Cost:<br />
Service cost $ 40 $ 34 $ 38 $ 2 $ 2 $ 2<br />
Interest cost 145 143 140 15 16 18<br />
Expected return on plan assets (180) (178) (159) - - -<br />
Amortization of:<br />
Prior service cost/(credit) 2 3 5 (34) (45) (44)<br />
Actuarial loss 71 49 30 11 13 12<br />
Net periodic benefit cost/(benefit) $ 78 $ 51 $ 54 $ (6) $ (14) $ (12)<br />
Assumptions – The weighted-average actuarial assumptions used to determine expense were as follows<br />
for the years ended December 31:<br />
Pension<br />
OPEB<br />
Percentages 2011 20<strong>10</strong> 2009 2011 20<strong>10</strong> 2009<br />
Discount rate 5.35% 5.90% 6.25% 5.01% 5.55% 6.25%<br />
Expected return on plan assets 7.50% 8.00% 8.00% N/A N/A N/A<br />
Compensation increase 4.48% 3.45% 3.50% N/A N/A N/A<br />
Health care cost trend rate (employees under 65) N/A N/A N/A 7.07% 7.24% 7.50%<br />
Health care cost trend rate (employees over 65) N/A N/A N/A N/A N/A 9.<strong>10</strong>%<br />
Ultimate health care cost trend rate N/A N/A N/A 4.50% 4.50% 4.50%<br />
Year ultimate trend reached N/A N/A N/A 2028 2028 2028<br />
The discount rate was based on a yield curve of high quality corporate bonds with cash flows matching<br />
our plans’ expected benefit payments. The expected return on plan assets is based on our asset<br />
allocation mix and our historical return, taking into account current and expected market conditions. The<br />
actual return on pension plan assets, net of fees, was approximately 2% in 2011, 14% in 20<strong>10</strong>, and 23%<br />
in 2009.<br />
64