Form 10-K - Union Pacific
Form 10-K - Union Pacific
Form 10-K - Union Pacific

Create successful ePaper yourself
Turn your PDF publications into a flip-book with our unique Google optimized e-Paper software.
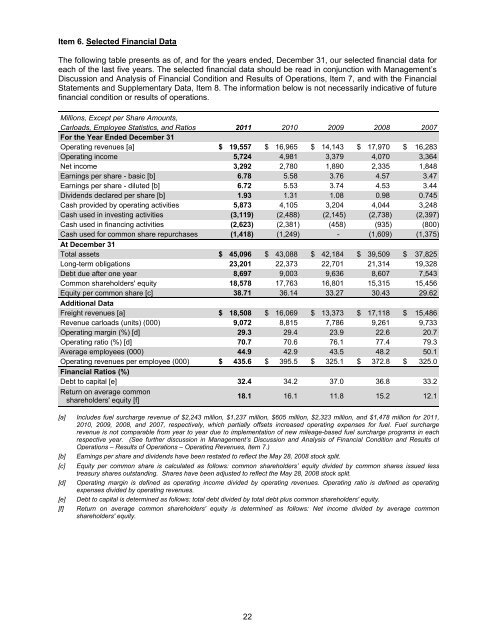
Item 6. Selected Financial Data<br />
The following table presents as of, and for the years ended, December 31, our selected financial data for<br />
each of the last five years. The selected financial data should be read in conjunction with Management’s<br />
Discussion and Analysis of Financial Condition and Results of Operations, Item 7, and with the Financial<br />
Statements and Supplementary Data, Item 8. The information below is not necessarily indicative of future<br />
financial condition or results of operations.<br />
Millions, Except per Share Amounts,<br />
Carloads, Employee Statistics, and Ratios 2011 20<strong>10</strong> 2009 2008 2007<br />
For the Year Ended December 31<br />
Operating revenues [a] $ 19,557 $ 16,965 $ 14,143 $ 17,970 $ 16,283<br />
Operating income 5,724 4,981 3,379 4,070 3,364<br />
Net income 3,292 2,780 1,890 2,335 1,848<br />
Earnings per share - basic [b] 6.78 5.58 3.76 4.57 3.47<br />
Earnings per share - diluted [b] 6.72 5.53 3.74 4.53 3.44<br />
Dividends declared per share [b] 1.93 1.31 1.08 0.98 0.745<br />
Cash provided by operating activities 5,873 4,<strong>10</strong>5 3,204 4,044 3,248<br />
Cash used in investing activities (3,119) (2,488) (2,145) (2,738) (2,397)<br />
Cash used in financing activities (2,623) (2,381) (458) (935) (800)<br />
Cash used for common share repurchases (1,418) (1,249) - (1,609) (1,375)<br />
At December 31<br />
Total assets $ 45,096 $ 43,088 $ 42,184 $ 39,509 $ 37,825<br />
Long-term obligations 23,201 22,373 22,701 21,314 19,328<br />
Debt due after one year 8,697 9,003 9,636 8,607 7,543<br />
Common shareholders' equity 18,578 17,763 16,801 15,315 15,456<br />
Equity per common share [c] 38.71 36.14 33.27 30.43 29.62<br />
Additional Data<br />
Freight revenues [a] $ 18,508 $ 16,069 $ 13,373 $ 17,118 $ 15,486<br />
Revenue carloads (units) (000) 9,072 8,815 7,786 9,261 9,733<br />
Operating margin (%) [d] 29.3 29.4 23.9 22.6 20.7<br />
Operating ratio (%) [d] 70.7 70.6 76.1 77.4 79.3<br />
Average employees (000) 44.9 42.9 43.5 48.2 50.1<br />
Operating revenues per employee (000) $ 435.6 $ 395.5 $ 325.1 $ 372.8 $ 325.0<br />
Financial Ratios (%)<br />
Debt to capital [e] 32.4 34.2 37.0 36.8 33.2<br />
Return on average common<br />
shareholders' equity [f]<br />
18.1 16.1 11.8 15.2 12.1<br />
[a] Includes fuel surcharge revenue of $2,243 million, $1,237 million, $605 million, $2,323 million, and $1,478 million for 2011,<br />
20<strong>10</strong>, 2009, 2008, and 2007, respectively, which partially offsets increased operating expenses for fuel. Fuel surcharge<br />
revenue is not comparable from year to year due to implementation of new mileage-based fuel surcharge programs in each<br />
respective year. (See further discussion in Management’s Discussion and Analysis of Financial Condition and Results of<br />
Operations – Results of Operations – Operating Revenues, Item 7.)<br />
[b] Earnings per share and dividends have been restated to reflect the May 28, 2008 stock split.<br />
[c]<br />
[d]<br />
[e]<br />
[f]<br />
Equity per common share is calculated as follows: common shareholders’ equity divided by common shares issued less<br />
treasury shares outstanding. Shares have been adjusted to reflect the May 28, 2008 stock split.<br />
Operating margin is defined as operating income divided by operating revenues. Operating ratio is defined as operating<br />
expenses divided by operating revenues.<br />
Debt to capital is determined as follows: total debt divided by total debt plus common shareholders' equity.<br />
Return on average common shareholders' equity is determined as follows: Net income divided by average common<br />
shareholders' equity.<br />
22