Form 10-K - Union Pacific
Form 10-K - Union Pacific
Form 10-K - Union Pacific

Create successful ePaper yourself
Turn your PDF publications into a flip-book with our unique Google optimized e-Paper software.
Positive Train Control – In response to a legislative mandate to implement PTC by the end of 2015,<br />
we expect to spend approximately $335 million during 2012 on developing and deploying PTC. We<br />
currently estimate that PTC in accordance with implementing rules issued by the Federal Rail<br />
Administration (FRA) will cost us approximately $2 billion by the end of 2015. This includes costs for<br />
installing the new system along our tracks, upgrading locomotives to work with the new system, and<br />
adding digital data communication equipment so all the parts of the system can communicate with<br />
each other. During 2012, we plan to continue testing the technology to evaluate its effectiveness.<br />
<br />
Financial Expectations – We are cautious about the economic environment but anticipate slow but<br />
steady volume growth that will exceed 2011 levels. Coupled with price, on-going network<br />
improvements and operational productivity initiatives, we expect earnings that exceed 2011 earnings.<br />
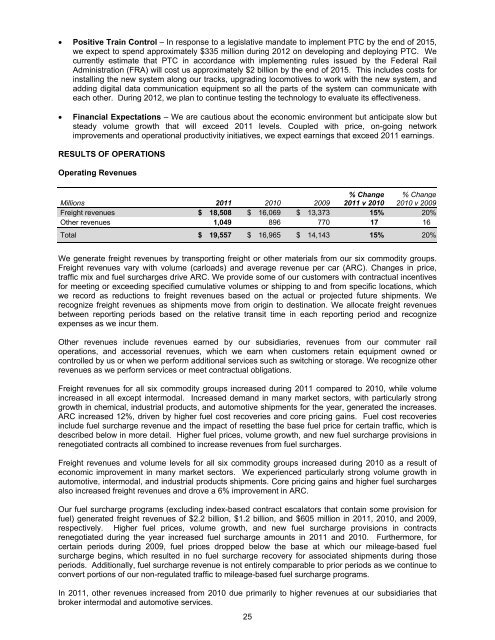
RESULTS OF OPERATIONS<br />
Operating Revenues<br />
Millions 2011 20<strong>10</strong> 2009<br />
% Change<br />
2011 v 20<strong>10</strong><br />
% Change<br />
20<strong>10</strong> v 2009<br />
Freight revenues $ 18,508 $ 16,069 $ 13,373 15% 20%<br />
Other revenues 1,049 896 770 17 16<br />
Total $ 19,557 $ 16,965 $ 14,143 15% 20%<br />
We generate freight revenues by transporting freight or other materials from our six commodity groups.<br />
Freight revenues vary with volume (carloads) and average revenue per car (ARC). Changes in price,<br />
traffic mix and fuel surcharges drive ARC. We provide some of our customers with contractual incentives<br />
for meeting or exceeding specified cumulative volumes or shipping to and from specific locations, which<br />
we record as reductions to freight revenues based on the actual or projected future shipments. We<br />
recognize freight revenues as shipments move from origin to destination. We allocate freight revenues<br />
between reporting periods based on the relative transit time in each reporting period and recognize<br />
expenses as we incur them.<br />
Other revenues include revenues earned by our subsidiaries, revenues from our commuter rail<br />
operations, and accessorial revenues, which we earn when customers retain equipment owned or<br />
controlled by us or when we perform additional services such as switching or storage. We recognize other<br />
revenues as we perform services or meet contractual obligations.<br />
Freight revenues for all six commodity groups increased during 2011 compared to 20<strong>10</strong>, while volume<br />
increased in all except intermodal. Increased demand in many market sectors, with particularly strong<br />
growth in chemical, industrial products, and automotive shipments for the year, generated the increases.<br />
ARC increased 12%, driven by higher fuel cost recoveries and core pricing gains. Fuel cost recoveries<br />
include fuel surcharge revenue and the impact of resetting the base fuel price for certain traffic, which is<br />
described below in more detail. Higher fuel prices, volume growth, and new fuel surcharge provisions in<br />
renegotiated contracts all combined to increase revenues from fuel surcharges.<br />
Freight revenues and volume levels for all six commodity groups increased during 20<strong>10</strong> as a result of<br />
economic improvement in many market sectors. We experienced particularly strong volume growth in<br />
automotive, intermodal, and industrial products shipments. Core pricing gains and higher fuel surcharges<br />
also increased freight revenues and drove a 6% improvement in ARC.<br />
Our fuel surcharge programs (excluding index-based contract escalators that contain some provision for<br />
fuel) generated freight revenues of $2.2 billion, $1.2 billion, and $605 million in 2011, 20<strong>10</strong>, and 2009,<br />
respectively. Higher fuel prices, volume growth, and new fuel surcharge provisions in contracts<br />
renegotiated during the year increased fuel surcharge amounts in 2011 and 20<strong>10</strong>. Furthermore, for<br />
certain periods during 2009, fuel prices dropped below the base at which our mileage-based fuel<br />
surcharge begins, which resulted in no fuel surcharge recovery for associated shipments during those<br />
periods. Additionally, fuel surcharge revenue is not entirely comparable to prior periods as we continue to<br />
convert portions of our non-regulated traffic to mileage-based fuel surcharge programs.<br />
In 2011, other revenues increased from 20<strong>10</strong> due primarily to higher revenues at our subsidiaries that<br />
broker intermodal and automotive services.<br />
25