Form 10-K - Union Pacific
Form 10-K - Union Pacific
Form 10-K - Union Pacific
You also want an ePaper? Increase the reach of your titles
YUMPU automatically turns print PDFs into web optimized ePapers that Google loves.
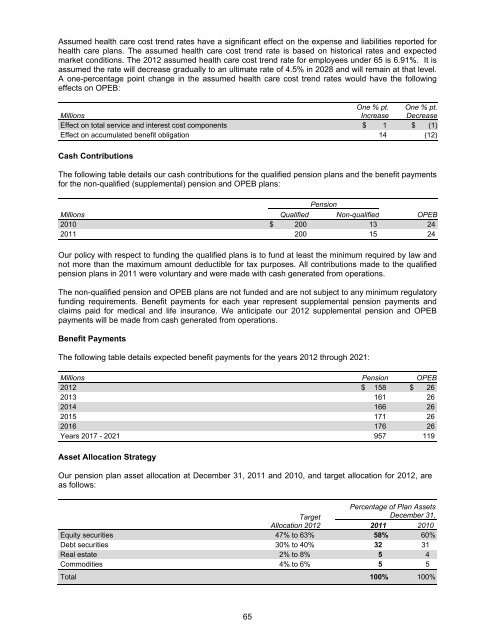
Assumed health care cost trend rates have a significant effect on the expense and liabilities reported for<br />
health care plans. The assumed health care cost trend rate is based on historical rates and expected<br />
market conditions. The 2012 assumed health care cost trend rate for employees under 65 is 6.91%. It is<br />
assumed the rate will decrease gradually to an ultimate rate of 4.5% in 2028 and will remain at that level.<br />
A one-percentage point change in the assumed health care cost trend rates would have the following<br />
effects on OPEB:<br />
Millions<br />
One % pt.<br />
Increase<br />
One % pt.<br />
Decrease<br />
Effect on total service and interest cost components $ 1 $ (1)<br />
Effect on accumulated benefit obligation 14 (12)<br />
Cash Contributions<br />
The following table details our cash contributions for the qualified pension plans and the benefit payments<br />
for the non-qualified (supplemental) pension and OPEB plans:<br />
Pension<br />
Millions Qualified Non-qualified OPEB<br />
20<strong>10</strong> $ 200 13 24<br />
2011 200 15 24<br />
Our policy with respect to funding the qualified plans is to fund at least the minimum required by law and<br />
not more than the maximum amount deductible for tax purposes. All contributions made to the qualified<br />
pension plans in 2011 were voluntary and were made with cash generated from operations.<br />
The non-qualified pension and OPEB plans are not funded and are not subject to any minimum regulatory<br />
funding requirements. Benefit payments for each year represent supplemental pension payments and<br />
claims paid for medical and life insurance. We anticipate our 2012 supplemental pension and OPEB<br />
payments will be made from cash generated from operations.<br />
Benefit Payments<br />
The following table details expected benefit payments for the years 2012 through 2021:<br />
Millions Pension OPEB<br />
2012 $ 158 $ 26<br />
2013 161 26<br />
2014 166 26<br />
2015 171 26<br />
2016 176 26<br />
Years 2017 - 2021 957 119<br />
Asset Allocation Strategy<br />
Our pension plan asset allocation at December 31, 2011 and 20<strong>10</strong>, and target allocation for 2012, are<br />
as follows:<br />
Percentage of Plan Assets<br />
Target<br />
December 31,<br />
Allocation 2012<br />
2011 20<strong>10</strong><br />
Equity securities 47% to 63% 58% 60%<br />
Debt securities 30% to 40% 32 31<br />
Real estate 2% to 8% 5 4<br />
Commodities 4% to 6% 5 5<br />
Total <strong>10</strong>0% <strong>10</strong>0%<br />
65


