Form 10-K - Union Pacific
Form 10-K - Union Pacific
Form 10-K - Union Pacific

You also want an ePaper? Increase the reach of your titles
YUMPU automatically turns print PDFs into web optimized ePapers that Google loves.
Item 7. Management’s Discussion and Analysis of Financial Condition and Results of Operations<br />
The following discussion should be read in conjunction with the Consolidated Financial Statements and<br />
applicable notes to the Financial Statements and Supplementary Data, Item 8, and other information in<br />
this report, including Risk Factors set forth in Item 1A and Critical Accounting Policies and Cautionary<br />
Information at the end of this Item 7.<br />
The Railroad, along with its subsidiaries and rail affiliates, is our one reportable business segment.<br />
Although revenue is analyzed by commodity, we analyze the net financial results of the Railroad as one<br />
segment due to the integrated nature of the rail network.<br />
EXECUTIVE SUMMARY<br />
2011 Results<br />
<br />
<br />
<br />
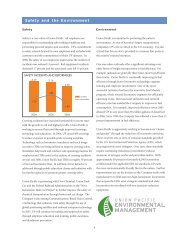
Safety – We continued improving safety in 2011 and set records in nearly all of our safety metrics.<br />
The employee injury incident rate per 200,000 man-hours declined 12% from 20<strong>10</strong>. These results<br />
reflect our continuing implementation of Total Safety Culture (TSC), an employee engagement<br />
initiative designed to establish, maintain, reinforce and promote safety practices among co-workers,<br />
along with increased risk identification, coaching and enhanced training. Our use of laser, ultrasound<br />
and acoustic vibration monitoring to identify potential wheel and axle failures before they occur<br />
reduced our equipment incident rate to 9.89 per million train miles, another best ever result. With<br />
respect to public safety, we closed 269 grade crossings in 2011 to reduce our exposure to incidents<br />
and continued using video cameras on our locomotives to assist in reviewing grade crossing<br />
incidents. We now have camera-equipped locomotives in the lead position on over 97% of our<br />
through-freight trains. During 2011, the rate of grade crossing incidents per million train miles<br />
decreased 9% from 20<strong>10</strong>, matching our record low for this measure. Overall, our 2011 safety results<br />
reflect our continued focus on the safety of our employees, our customers and the public.<br />
Financial Performance – In 2011, we continued our record-setting trend by generating operating<br />
income of $5.7 billion, a 15% increase over 20<strong>10</strong>. Improved pricing and 3% volume growth, partially<br />
offset by inflation and weather-related costs, drove this increase. Our operating ratio for 2011 was<br />
70.7%, only slightly behind last year’s record of 70.6%. Net income of $3.3 billion surpassed our<br />
previous milestone set in 20<strong>10</strong>, translating into earnings of $6.72 per diluted share for 2011.<br />
Freight Revenues – Our freight revenues grew 15% year-over-year to $18.5 billion. Freight revenues<br />
for all six commodity groups increased while volume increased in all groups except intermodal, which<br />
declined 2%. Overall, volume increased 3% in 2011, with particularly strong growth in chemicals,<br />
industrial products, and automotive shipments. Higher fuel surcharges (due to higher fuel prices,<br />
volume growth, and new fuel surcharge provisions in renegotiated contracts) and core pricing gains<br />
also drove the growth in freight revenue in 2011 compared to 20<strong>10</strong>.<br />
Network Operations – Weather impacted our operations more significantly in 2011 than 20<strong>10</strong>,<br />
including blizzards affecting the Southwest and Midwest, particularly the Chicago area, historic<br />
Midwestern floods and severe heat and drought in our Southern Region. We deployed resources to<br />
address these adverse conditions and maintained reliable network operations. As reported to the<br />
Association of American Railroads (AAR), average train speed decreased 2% in 2011 compared to<br />
20<strong>10</strong>, reflecting the weather challenges, in addition to increased carloadings and changes in traffic<br />
mix. Average terminal dwell time increased 3% due to the same factors that affected train speed<br />
along with a more active track replacement program, which can adversely affect operations. Average<br />
rail car inventory decreased slightly, despite a 3% increase in volume, reflecting our efforts to adjust<br />
our freight car fleet to match operating performance and demand. Despite these operating<br />
challenges, we established a new record in our customer satisfaction index in 2011, an indication that<br />
our ongoing efforts to improve operations translated into value for our customers.<br />
<br />
Fuel Prices – The 2011 barrel price averaged almost 20% higher than 20<strong>10</strong>, peaking in April, as the<br />
global economy strengthened and the U.S. dollar weakened. Our average diesel fuel price per gallon<br />
rose 21% from January to December of 2011, due to higher prices for crude oil and conversion<br />
spreads. Compared to 20<strong>10</strong>, our price per gallon of diesel fuel consumed increased 36%, driving<br />
operating expenses up $922 million (excluding any impact from year-over-year volume), which<br />
accounted for almost half of the total increase in operating cost. Higher traffic volume accounted for<br />
23