BROOKER ANNUAL REPORT 2012
BROOKER ANNUAL REPORT 2012
BROOKER ANNUAL REPORT 2012

Create successful ePaper yourself
Turn your PDF publications into a flip-book with our unique Google optimized e-Paper software.
Annual Report <strong>2012</strong><br />
The Brooker Group Public Co Ltd<br />
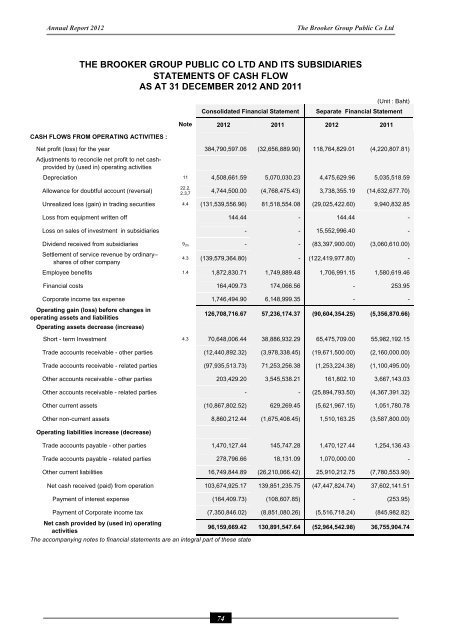
THE <strong>BROOKER</strong> GROUP PUBLIC CO LTD AND ITS SUBSIDIARIES<br />
STATEMENTS OF CASH FLOW<br />
AS AT 31 DECEMBER <strong>2012</strong> AND 2011<br />
(Unit : Baht)<br />
Consolidated Financial Statement<br />
Separate Financial Statement<br />
Note <strong>2012</strong> 2011 <strong>2012</strong> 2011<br />
CASH FLOWS FROM OPERATING ACTIVITIES :<br />
Net profit (loss) for the year 384,790,597.06 (32,656,889.90) 118,764,829.01 (4,220,807.81)<br />
Adjustments to reconcile net profit to net cashprovided<br />
by (used in) operating activities<br />
Depreciation 11 4,508,661.59 5,070,030.23 4,475,629.96 5,035,518.59<br />
Allowance for doubtful account (reversal)<br />
22.2,<br />
2.3,7 4,744,500.00 (4,768,475.43) 3,738,355.19 (14,632,677.70)<br />
Unrealized loss (gain) in trading securities 4.4 (131,539,556.96) 81,518,554.08 (29,025,422.60) 9,940,832.85<br />
Loss from equipment written off 144.44 - 144.44 -<br />
Loss on sales of investment in subsidiaries - - 15,552,996.40 -<br />
Dividend received from subsidiaries 9 (3) - - (83,397,900.00) (3,060,610.00)<br />
Settlement of service revenue by ordinary–<br />
shares of other company<br />
4.3 (139,579,364.80) - (122,419,977.80) -<br />
Employee benefits 1.4 1,872,830.71 1,749,889.48 1,706,991.15 1,580,619.46<br />
Financial costs 164,409.73 174,066.56 - 253.95<br />
Corporate income tax expense 1,746,494.90 6,148,999.35 - -<br />
Operating gain (loss) before changes in<br />
operating assets and liabilities<br />
Operating assets decrease (increase)<br />
126,708,716.67 57,236,174.37 (90,604,354.25) (5,356,870.66)<br />
Short - term Investment 4.3 70,648,006.44 38,886,932.29 65,475,709.00 55,982,192.15<br />
Trade accounts receivable - other parties (12,440,892.32) (3,978,338.45) (19,671,500.00) (2,160,000.00)<br />
Trade accounts receivable - related parties (97,935,513.73) 71,253,256.38 (1,253,224.38) (1,100,495.00)<br />
Other accounts receivable - other parties 203,429.20 3,545,538.21 161,802.10 3,667,143.03<br />
Other accounts receivable - related parties - - (25,894,793.50) (4,367,391.32)<br />
Other current assets (10,867,802.52) 629,269.45 (5,621,967.15) 1,051,780.78<br />
Other non-current assets 8,860,212.44 (1,675,408.45) 1,510,163.25 (3,587,800.00)<br />
Operating liabilities increase (decrease)<br />
Trade accounts payable - other parties 1,470,127.44 145,747.28 1,470,127.44 1,254,136.43<br />
Trade accounts payable - related parties 278,796.66 18,131.09 1,070,000.00 -<br />
Other current liabilities 16,749,844.89 (26,210,066.42) 25,910,212.75 (7,780,553.90)<br />
Net cash received (paid) from operation 103,674,925.17 139,851,235.75 (47,447,824.74) 37,602,141.51<br />
Payment of interest expense (164,409.73) (108,607.85) - (253.95)<br />
Payment of Corporate income tax (7,350,846.02) (8,851,080.26) (5,516,718.24) (845,982.82)<br />
Net cash provided by (used in) operating<br />
96,159,669.42 130,891,547.64 (52,964,542.98) 36,755,904.74<br />
activities<br />
The accompanying notes to financial statements are an integral part of these state<br />
74