Global Study On Child Poverty And Disparities (PDF) - Social Policy ...
Global Study On Child Poverty And Disparities (PDF) - Social Policy ...
Global Study On Child Poverty And Disparities (PDF) - Social Policy ...

You also want an ePaper? Increase the reach of your titles
YUMPU automatically turns print PDFs into web optimized ePapers that Google loves.
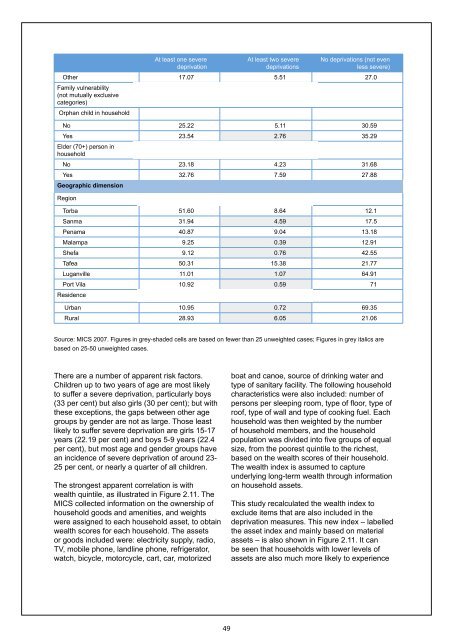
At least one severe<br />
deprivation<br />
At least two severe<br />
deprivations<br />
No deprivations (not even<br />
less severe)<br />
Other 17.07 5.51 27.0<br />
Family vulnerability<br />
(not mutually exclusive<br />
categories)<br />
Orphan child in household<br />
No 25.22 5.11 30.59<br />
Yes 23.54 2.76 35.29<br />
Elder (70+) person in<br />
household<br />
No 23.18 4.23 31.68<br />
Yes 32.76 7.59 27.88<br />
Geographic dimension<br />
Region<br />
Torba 51.60 8.64 12.1<br />
Sanma 31.94 4.59 17.5<br />
Penama 40.87 9.04 13.18<br />
Malampa 9.25 0.39 12.91<br />
Shefa 9.12 0.76 42.55<br />
Tafea 50.31 15.38 21.77<br />
Luganville 11.01 1.07 64.91<br />
Port Vila 10.92 0.59 71<br />
Residence<br />
Urban 10.95 0.72 69.35<br />
Rural 28.93 6.05 21.06<br />
Source: MICS 2007. Figures in grey-shaded cells are based on fewer than 25 unweighted cases; Figures in grey italics are<br />
based on 25-50 unweighted cases.<br />
There are a number of apparent risk factors.<br />
<strong>Child</strong>ren up to two years of age are most likely<br />
to suffer a severe deprivation, particularly boys<br />
(33 per cent) but also girls (30 per cent); but with<br />
these exceptions, the gaps between other age<br />
groups by gender are not as large. Those least<br />
likely to suffer severe deprivation are girls 15-17<br />
years (22.19 per cent) and boys 5-9 years (22.4<br />
per cent), but most age and gender groups have<br />
an incidence of severe deprivation of around 23-<br />
25 per cent, or nearly a quarter of all children.<br />
The strongest apparent correlation is with<br />
wealth quintile, as illustrated in Figure 2.11. The<br />
MICS collected information on the ownership of<br />
household goods and amenities, and weights<br />
were assigned to each household asset, to obtain<br />
wealth scores for each household. The assets<br />
or goods included were: electricity supply, radio,<br />
TV, mobile phone, landline phone, refrigerator,<br />
watch, bicycle, motorcycle, cart, car, motorized<br />
boat and canoe, source of drinking water and<br />
type of sanitary facility. The following household<br />
characteristics were also included: number of<br />
persons per sleeping room, type of floor, type of<br />
roof, type of wall and type of cooking fuel. Each<br />
household was then weighted by the number<br />
of household members, and the household<br />
population was divided into five groups of equal<br />
size, from the poorest quintile to the richest,<br />
based on the wealth scores of their household.<br />
The wealth index is assumed to capture<br />
underlying long-term wealth through information<br />
on household assets.<br />
This study recalculated the wealth index to<br />
exclude items that are also included in the<br />
deprivation measures. This new index – labelled<br />
the asset index and mainly based on material<br />
assets – is also shown in Figure 2.11. It can<br />
be seen that households with lower levels of<br />
assets are also much more likely to experience<br />
49