Table Of Contents
Table Of Contents
Table Of Contents

You also want an ePaper? Increase the reach of your titles
YUMPU automatically turns print PDFs into web optimized ePapers that Google loves.
1.5 Tutorial Experiments<br />
The next two tutorial experiments are recommended for every new user before beginning<br />
analysis of their own samples. They are designed to provide standard results, which check that<br />
the instrument is working well and the user is comfortable with the procedures, before risking<br />
precious sample.<br />
Water/Water Tutorial:<br />
The first tutorial involves titrating water into water.<br />
1. Fill both cells with degassed (5 min) distilled water, fill the titration syringe, and insert the<br />
syringe into the sample cell.<br />
2. Click on the “Load Run File” button in the “Advanced Experimental Design” tab, choose<br />
“WATER.INJ”, and click “Open”. Name the run and click “Start”. The instrument will seek<br />
the run temperature, equilibrate the system, and begin making injections. Each peak should<br />
be small, with all the peaks approximately the same shape.<br />
3. Once the run has finished and the instrument is thermostatting again, open the ITC<br />
Calibrations project to analyze the data. It is located in the Origin directory, at<br />
C:\Origin70\ITCCalibrations.OPJ.<br />
4. Click on the “Water Water Report” button. A window will pop up asking which files to<br />
analyze; select the file you just generated, click “Add Files”, and click “OK”.<br />
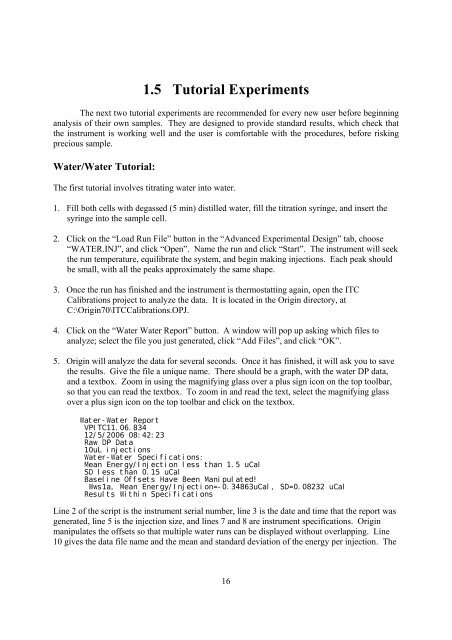
5. Origin will analyze the data for several seconds. Once it has finished, it will ask you to save<br />
the results. Give the file a unique name. There should be a graph, with the water DP data,<br />
and a textbox. Zoom in using the magnifying glass over a plus sign icon on the top toolbar,<br />
so that you can read the textbox. To zoom in and read the text, select the magnifying glass<br />
over a plus sign icon on the top toolbar and click on the textbox.<br />
Water-Water Report<br />
VPITC11.06.834<br />
12/5/2006 08:42:23<br />
Raw DP Data<br />
10uL injections<br />
Water-Water Specifications:<br />
Mean Energy/Injection less than 1.5 uCal<br />
SD less than 0.15 uCal<br />
Baseline <strong>Of</strong>fsets Have Been Manipulated!<br />
Wws1a, Mean Energy/Injection=-0.34863uCal, SD=0.08232 uCal<br />
Results Within Specifications<br />
Line 2 of the script is the instrument serial number, line 3 is the date and time that the report was<br />
generated, line 5 is the injection size, and lines 7 and 8 are instrument specifications. Origin<br />
manipulates the offsets so that multiple water runs can be displayed without overlapping. Line<br />
10 gives the data file name and the mean and standard deviation of the energy per injection. The<br />
16