Table Of Contents
Table Of Contents
Table Of Contents

You also want an ePaper? Increase the reach of your titles
YUMPU automatically turns print PDFs into web optimized ePapers that Google loves.
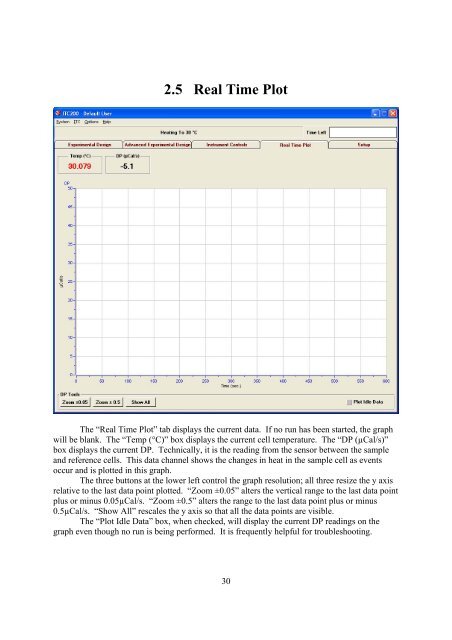
2.5 Real Time Plot<br />
The “Real Time Plot” tab displays the current data. If no run has been started, the graph<br />
will be blank. The “Temp (°C)” box displays the current cell temperature. The “DP (µCal/s)”<br />
box displays the current DP. Technically, it is the reading from the sensor between the sample<br />
and reference cells. This data channel shows the changes in heat in the sample cell as events<br />
occur and is plotted in this graph.<br />
The three buttons at the lower left control the graph resolution; all three resize the y axis<br />
relative to the last data point plotted. “Zoom ±0.05” alters the vertical range to the last data point<br />
plus or minus 0.05µCal/s. “Zoom ±0.5” alters the range to the last data point plus or minus<br />
0.5µCal/s. “Show All” rescales the y axis so that all the data points are visible.<br />
The “Plot Idle Data” box, when checked, will display the current DP readings on the<br />
graph even though no run is being performed. It is frequently helpful for troubleshooting.<br />
30