Table Of Contents
Table Of Contents
Table Of Contents

Create successful ePaper yourself
Turn your PDF publications into a flip-book with our unique Google optimized e-Paper software.
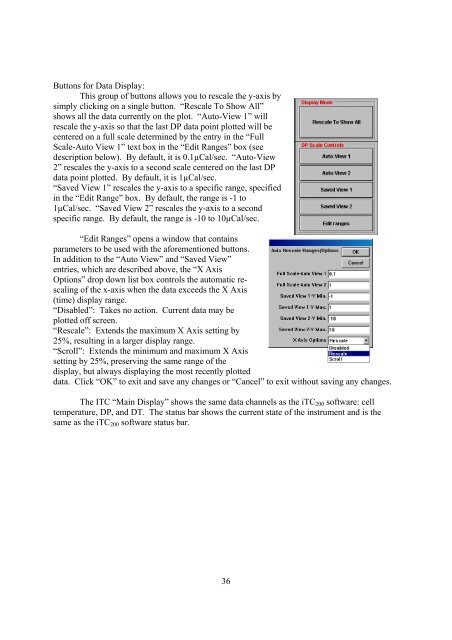
Buttons for Data Display:<br />
This group of buttons allows you to rescale the y-axis by<br />
simply clicking on a single button. “Rescale To Show All”<br />
shows all the data currently on the plot. “Auto-View 1” will<br />
rescale the y-axis so that the last DP data point plotted will be<br />
centered on a full scale determined by the entry in the “Full<br />
Scale-Auto View 1” text box in the “Edit Ranges” box (see<br />
description below). By default, it is 0.1µCal/sec. “Auto-View<br />
2” rescales the y-axis to a second scale centered on the last DP<br />
data point plotted. By default, it is 1µCal/sec.<br />
“Saved View 1” rescales the y-axis to a specific range, specified<br />
in the “Edit Range” box. By default, the range is -1 to<br />
1µCal/sec. “Saved View 2” rescales the y-axis to a second<br />
specific range. By default, the range is -10 to 10µCal/sec.<br />
“Edit Ranges” opens a window that contains<br />
parameters to be used with the aforementioned buttons.<br />
In addition to the “Auto View” and “Saved View”<br />
entries, which are described above, the “X Axis<br />
Options” drop down list box controls the automatic rescaling<br />
of the x-axis when the data exceeds the X Axis<br />
(time) display range.<br />
“Disabled”: Takes no action. Current data may be<br />
plotted off screen.<br />
“Rescale”: Extends the maximum X Axis setting by<br />
25%, resulting in a larger display range.<br />
“Scroll”: Extends the minimum and maximum X Axis<br />
setting by 25%, preserving the same range of the<br />
display, but always displaying the most recently plotted<br />
data. Click “OK” to exit and save any changes or “Cancel” to exit without saving any changes.<br />
The ITC “Main Display” shows the same data channels as the iTC 200 software: cell<br />
temperature, DP, and DT. The status bar shows the current state of the instrument and is the<br />
same as the iTC 200 software status bar.<br />
36