Jupiter Annual Report 2010 - Jupiter Asset Management
Jupiter Annual Report 2010 - Jupiter Asset Management
Jupiter Annual Report 2010 - Jupiter Asset Management

Create successful ePaper yourself
Turn your PDF publications into a flip-book with our unique Google optimized e-Paper software.
Financial statements – continuation | Notes to the financial statements<br />
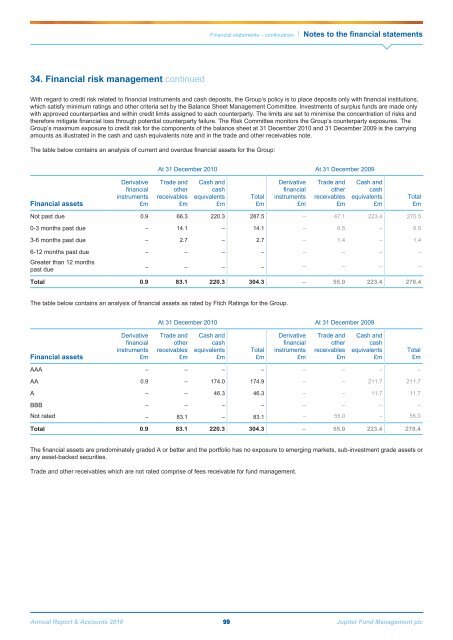
34. Financial risk management continued<br />
With regard to credit risk related to financial instruments and cash deposits, the Group’s policy is to place deposits only with financial institutions,<br />
which satisfy minimum ratings and other criteria set by the Balance Sheet <strong>Management</strong> Committee. Investments of surplus funds are made only<br />
with approved counterparties and within credit limits assigned to each counterparty. The limits are set to minimise the concentration of risks and<br />
therefore mitigate financial loss through potential counterparty failure. The Risk Committee monitors the Group’s counterparty exposures. The<br />
Group’s maximum exposure to credit risk for the components of the balance sheet at 31 December <strong>2010</strong> and 31 December 2009 is the carrying<br />
amounts as illustrated in the cash and cash equivalents note and in the trade and other receivables note.<br />
The table below contains an analysis of current and overdue financial assets for the Group:<br />
At 31 December <strong>2010</strong> At 31 December 2009<br />
Financial assets<br />
Derivative<br />
financial<br />
instruments<br />
£m<br />
Trade and<br />
other<br />
receivables<br />
£m<br />
Cash and<br />
cash<br />
equivalents<br />
£m<br />
Total<br />
£m<br />
Derivative<br />
financial<br />
instruments<br />
£m<br />
Trade and<br />
other<br />
receivables<br />
£m<br />
Cash and<br />
cash<br />
equivalents<br />
£m<br />
Total<br />
£m<br />
Not past due 0.9 66.3 220.3 287.5 – 47.1 223.4 270.5<br />
0-3 months past due – 14.1 – 14.1 – 6.5 – 6.5<br />
3-6 months past due – 2.7 – 2.7 – 1.4 – 1.4<br />
6-12 months past due – – – – – – – –<br />
Greater than 12 months<br />
past due<br />
– – – – – – – –<br />
Total 0.9 83.1 220.3 304.3 – 55.0 223.4 278.4<br />
The table below contains an analysis of financial assets as rated by Fitch Ratings for the Group.<br />
At 31 December <strong>2010</strong> At 31 December 2009<br />
Financial assets<br />
Derivative<br />
financial<br />
instruments<br />
£m<br />
Trade and<br />
other<br />
receivables<br />
£m<br />
Cash and<br />
cash<br />
equivalents<br />
£m<br />
Total<br />
£m<br />
Derivative<br />
financial<br />
instruments<br />
£m<br />
Trade and<br />
other<br />
receivables<br />
£m<br />
Cash and<br />
cash<br />
equivalents<br />
£m<br />
Total<br />
£m<br />
AAA – – – – – – – –<br />
AA 0.9 – 174.0 174.9 – – 211.7 211.7<br />
A – – 46.3 46.3 – – 11.7 11.7<br />
BBB – – – – – – – –<br />
Not rated – 83.1 – 83.1 – 55.0 – 55.0<br />
Total 0.9 83.1 220.3 304.3 – 55.0 223.4 278.4<br />
The financial assets are predominately graded A or better and the portfolio has no exposure to emerging markets, sub-investment grade assets or<br />
any asset-backed securities.<br />
Trade and other receivables which are not rated comprise of fees receivable for fund management.<br />
<strong>Annual</strong> <strong>Report</strong> & Accounts <strong>2010</strong> 99 <strong>Jupiter</strong> Fund <strong>Management</strong> plc