Jupiter Annual Report 2010 - Jupiter Asset Management
Jupiter Annual Report 2010 - Jupiter Asset Management
Jupiter Annual Report 2010 - Jupiter Asset Management

You also want an ePaper? Increase the reach of your titles
YUMPU automatically turns print PDFs into web optimized ePapers that Google loves.
Business review | Directors’ report<br />
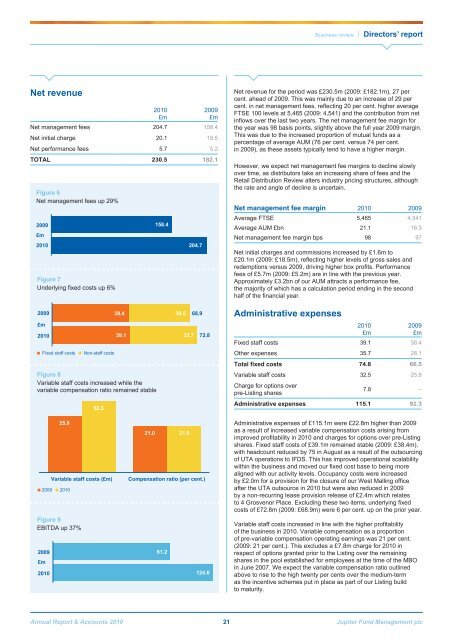
Net revenue<br />
Figure 7<br />
Underlying fixed costs up 6%<br />
<strong>2010</strong><br />
£m<br />
2009<br />
£m<br />
Net management fees 204.7 158.4<br />
Net initial charge 20.1 18.5<br />
Net performance fees 5.7 5.2<br />
TOTAL 230.5 182.1<br />
Figure 6<br />
Net management fees up 29%<br />
2009<br />
£m<br />
<strong>2010</strong><br />
158.4<br />
204.7<br />
Net revenue for the period was £230.5m (2009: £182.1m), 27 per<br />
cent. ahead of 2009. This was mainly due to an increase of 29 per<br />
cent. in net management fees, reflecting 20 per cent. higher average<br />
FTSE 100 levels at 5,465 (2009: 4,541) and the contribution from net<br />
inflows over the last two years. The net management fee margin for<br />
the year was 98 basis points, slightly above the full year 2009 margin.<br />
This was due to the increased proportion of mutual funds as a<br />
percentage of average AUM (76 per cent. versus 74 per cent.<br />
in 2009), as these assets typically tend to have a higher margin.<br />
However, we expect net management fee margins to decline slowly<br />
over time, as distributors take an increasing share of fees and the<br />
Retail Distribution Review alters industry pricing structures, although<br />
the rate and angle of decline is uncertain.<br />
Net management fee margin <strong>2010</strong> 2009<br />
Average FTSE 5,465 4,541<br />
Average AUM £bn 21.1 16.3<br />
Net management fee margin bps 98 97<br />
Net initial charges and commissions increased by £1.6m to<br />
£20.1m (2009: £18.5m), reflecting higher levels of gross sales and<br />
redemptions versus 2009, driving higher box profits. Performance<br />
fees of £5.7m (2009: £5.2m) are in line with the previous year.<br />
Approximately £3.2bn of our AUM attracts a performance fee,<br />
the majority of which has a calculation period ending in the second<br />
half of the financial year.<br />
2009<br />
£m<br />
<strong>2010</strong><br />
Fixed staff costs<br />
Non-staff costs<br />
38.4<br />
39.1<br />
Figure 8<br />
Variable staff costs increased while the<br />
variable compensation ratio remained stable<br />
32.5<br />
30.5 68.9<br />
33.7 72.8<br />
Administrative expenses<br />
<strong>2010</strong><br />
£m<br />
2009<br />
£m<br />
Fixed staff costs 39.1 38.4<br />
Other expenses 35.7 28.1<br />
Total fixed costs 74.8 66.5<br />
Variable staff costs 32.5 25.8<br />
Charge for options over<br />
pre-Listing shares<br />
7.8 –<br />
Administrative expenses 115.1 92.3<br />
Figure 9<br />
EBITDA up 37%<br />
2009<br />
£m<br />
2009<br />
<strong>2010</strong><br />
25.8<br />
Variable staff costs (£m)<br />
<strong>2010</strong><br />
21.0 21.0<br />
Compensation ratio (per cent.)<br />
91.2<br />
124.6<br />
Administrative expenses of £115.1m were £22.8m higher than 2009<br />
as a result of increased variable compensation costs arising from<br />
improved profitability in <strong>2010</strong> and charges for options over pre-Listing<br />
shares. Fixed staff costs of £39.1m remained stable (2009: £38.4m),<br />
with headcount reduced by 75 in August as a result of the outsourcing<br />
of UTA operations to IFDS. This has improved operational scalability<br />
within the business and moved our fixed cost base to being more<br />
aligned with our activity levels. Occupancy costs were increased<br />
by £2.0m for a provision for the closure of our West Malling office<br />
after the UTA outsource in <strong>2010</strong> but were also reduced in 2009<br />
by a non-recurring lease provision release of £2.4m which relates<br />
to 4 Grosvenor Place. Excluding these two items, underlying fixed<br />
costs of £72.8m (2009: £68.9m) were 6 per cent. up on the prior year.<br />
Variable staff costs increased in line with the higher profitability<br />
of the business in <strong>2010</strong>. Variable compensation as a proportion<br />
of pre-variable compensation operating earnings was 21 per cent.<br />
(2009: 21 per cent.). This excludes a £7.8m charge for <strong>2010</strong> in<br />
respect of options granted prior to the Listing over the remaining<br />
shares in the pool established for employees at the time of the MBO<br />
in June 2007. We expect the variable compensation ratio outlined<br />
above to rise to the high twenty per cents over the medium-term<br />
as the incentive schemes put in place as part of our Listing build<br />
to maturity.<br />
<strong>Annual</strong> <strong>Report</strong> & Accounts <strong>2010</strong> 21 <strong>Jupiter</strong> Fund <strong>Management</strong> plc