Jupiter Annual Report 2010 - Jupiter Asset Management
Jupiter Annual Report 2010 - Jupiter Asset Management
Jupiter Annual Report 2010 - Jupiter Asset Management

You also want an ePaper? Increase the reach of your titles
YUMPU automatically turns print PDFs into web optimized ePapers that Google loves.
Financial statements – continuation | Notes to the financial statements<br />
34. Financial risk management continued<br />
■■Liquidity risk<br />
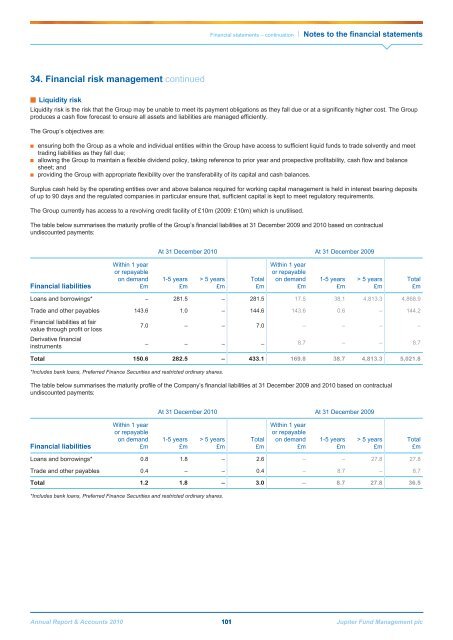
Liquidity risk is the risk that the Group may be unable to meet its payment obligations as they fall due or at a significantly higher cost. The Group<br />
produces a cash flow forecast to ensure all assets and liabilities are managed efficiently.<br />
The Group’s objectives are:<br />
■■<br />
■■<br />
■■<br />
ensuring both the Group as a whole and individual entities within the Group have access to sufficient liquid funds to trade solvently and meet<br />
trading liabilities as they fall due;<br />
allowing the Group to maintain a flexible dividend policy, taking reference to prior year and prospective profitability, cash flow and balance<br />
sheet; and<br />
providing the Group with appropriate flexibility over the transferability of its capital and cash balances.<br />
Surplus cash held by the operating entities over and above balance required for working capital management is held in interest bearing deposits<br />
of up to 90 days and the regulated companies in particular ensure that, sufficient capital is kept to meet regulatory requirements.<br />
The Group currently has access to a revolving credit facility of £10m (2009: £10m) which is unutilised.<br />
The table below summarises the maturity profile of the Group’s financial liabilities at 31 December 2009 and <strong>2010</strong> based on contractual<br />
undiscounted payments:<br />
At 31 December <strong>2010</strong> At 31 December 2009<br />
Financial liabilities<br />
Within 1 year<br />
or repayable<br />
on demand<br />
£m<br />
1-5 years<br />
£m<br />
> 5 years<br />
£m<br />
Total<br />
£m<br />
Within 1 year<br />
or repayable<br />
on demand<br />
£m<br />
1-5 years<br />
£m<br />
> 5 years<br />
£m<br />
Total<br />
£m<br />
Loans and borrowings* – 281.5 – 281.5 17.5 38.1 4,813.3 4,868.9<br />
Trade and other payables 143.6 1.0 – 144.6 143.6 0.6 – 144.2<br />
Financial liabilities at fair<br />
value through profit or loss<br />
Derivative financial<br />
instruments<br />
7.0 – – 7.0 – – – –<br />
– – – – 8.7 – – 8.7<br />
Total 150.6 282.5 – 433.1 169.8 38.7 4,813.3 5,021.8<br />
*Includes bank loans, Preferred Finance Securities and restricted ordinary shares.<br />
The table below summarises the maturity profile of the Company’s financial liabilities at 31 December 2009 and <strong>2010</strong> based on contractual<br />
undiscounted payments:<br />
At 31 December <strong>2010</strong> At 31 December 2009<br />
Financial liabilities<br />
Within 1 year<br />
or repayable<br />
on demand<br />
£m<br />
1-5 years<br />
£m<br />
> 5 years<br />
£m<br />
Total<br />
£m<br />
Within 1 year<br />
or repayable<br />
on demand<br />
£m<br />
1-5 years<br />
£m<br />
> 5 years<br />
£m<br />
Total<br />
£m<br />
Loans and borrowings* 0.8 1.8 – 2.6 – – 27.8 27.8<br />
Trade and other payables 0.4 – – 0.4 – 8.7 – 8.7<br />
Total 1.2 1.8 – 3.0 – 8.7 27.8 36.5<br />
*Includes bank loans, Preferred Finance Securities and restricted ordinary shares.<br />
<strong>Annual</strong> <strong>Report</strong> & Accounts <strong>2010</strong> 101 <strong>Jupiter</strong> Fund <strong>Management</strong> plc