Jupiter Annual Report 2010 - Jupiter Asset Management
Jupiter Annual Report 2010 - Jupiter Asset Management
Jupiter Annual Report 2010 - Jupiter Asset Management

Create successful ePaper yourself
Turn your PDF publications into a flip-book with our unique Google optimized e-Paper software.
Business review | Directors’ report<br />
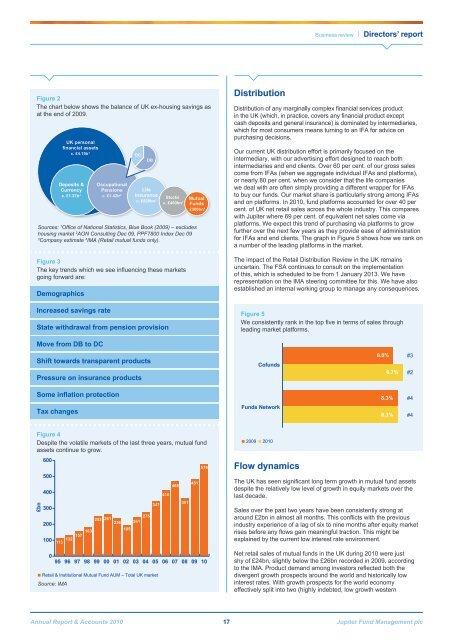
Figure 2<br />
The chart below shows the balance of UK ex-housing savings as<br />
at the end of 2009.<br />
UK personal<br />
financial assets<br />
c. £4.15tr 1<br />
Deposits & Occupational<br />
Currency Pensions Life<br />
c. £1.37tr 1 c. £1.42tr 2 Insurance Stocks Mutual<br />
c. £820bn 3 c. £460bn 1<br />
Funds<br />
£300bn 4<br />
Sources: 1 Office of National Statistics, Blue Book (2009) – excludes<br />
housing market 2 AON Consulting Dec 09, PPF7800 Index Dec 09<br />
3<br />
Company estimate 4 IMA (Retail mutual funds only).<br />
Figure 3<br />
The key trends which we see influencing these markets<br />
going forward are:<br />
Demographics<br />
Increased savings rate<br />
State withdrawal from pension provision<br />
DC<br />
DB<br />
Distribution<br />
Distribution of any marginally complex financial services product<br />
in the UK (which, in practice, covers any financial product except<br />
cash deposits and general insurance) is dominated by intermediaries,<br />
which for most consumers means turning to an IFA for advice on<br />
purchasing decisions.<br />
Our current UK distribution effort is primarily focused on the<br />
intermediary, with our advertising effort designed to reach both<br />
intermediaries and end clients. Over 60 per cent. of our gross sales<br />
come from IFAs (when we aggregate individual IFAs and platforms),<br />
or nearly 80 per cent. when we consider that the life companies<br />
we deal with are often simply providing a different wrapper for IFAs<br />
to buy our funds. Our market share is particularly strong among IFAs<br />
and on platforms. In <strong>2010</strong>, fund platforms accounted for over 40 per<br />
cent. of UK net retail sales across the whole industry. This compares<br />
with <strong>Jupiter</strong> where 69 per cent. of equivalent net sales come via<br />
platforms. We expect this trend of purchasing via platforms to grow<br />
further over the next few years as they provide ease of administration<br />
for IFAs and end clients. The graph in Figure 5 shows how we rank on<br />
a number of the leading platforms in the market.<br />
The impact of the Retail Distribution Review in the UK remains<br />
uncertain. The FSA continues to consult on the implementation<br />
of this, which is scheduled to be from 1 January 2013. We have<br />
representation on the IMA steering committee for this. We have also<br />
established an internal working group to manage any consequences.<br />
Figure 5<br />
We consistently rank in the top five in terms of sales through<br />
leading market platforms.<br />
Move from DB to DC<br />
Shift towards transparent products<br />
Pressure on insurance products<br />
Cofunds<br />
8.0%<br />
8.7%<br />
#3<br />
#2<br />
Some inflation protection<br />
8.3%<br />
#4<br />
Tax changes<br />
Funds Network<br />
8.3%<br />
#4<br />
Figure 4<br />
Despite the volatile markets of the last three years, mutual fund<br />
assets continue to grow.<br />
£bn<br />
600<br />
500<br />
400<br />
300<br />
200<br />
100<br />
183<br />
157<br />
132<br />
113<br />
253 261<br />
236<br />
195<br />
275<br />
241<br />
347<br />
410<br />
468<br />
361<br />
481<br />
578<br />
2009 <strong>2010</strong><br />
Flow dynamics<br />
The UK has seen significant long term growth in mutual fund assets<br />
despite the relatively low level of growth in equity markets over the<br />
last decade.<br />
Sales over the past two years have been consistently strong at<br />
around £2bn in almost all months. This conflicts with the previous<br />
industry experience of a lag of six to nine months after equity market<br />
rises before any flows gain meaningful traction. This might be<br />
explained by the current low interest rate environment.<br />
0<br />
95 96 97 98 99 00 01 02 03 04 05<br />
Retail & Institutional Mutual Fund AUM – Total UK market<br />
Source: IMA<br />
06<br />
07<br />
08<br />
09<br />
10<br />
Net retail sales of mutual funds in the UK during <strong>2010</strong> were just<br />
shy of £24bn, slightly below the £26bn recorded in 2009, according<br />
to the IMA. Product demand among investors reflected both the<br />
divergent growth prospects around the world and historically low<br />
interest rates. With growth prospects for the world economy<br />
effectively split into two (highly indebted, low growth western<br />
<strong>Annual</strong> <strong>Report</strong> & Accounts <strong>2010</strong> 17 <strong>Jupiter</strong> Fund <strong>Management</strong> plc