Jupiter Annual Report 2010 - Jupiter Asset Management
Jupiter Annual Report 2010 - Jupiter Asset Management
Jupiter Annual Report 2010 - Jupiter Asset Management

You also want an ePaper? Increase the reach of your titles
YUMPU automatically turns print PDFs into web optimized ePapers that Google loves.
Business review | Directors’ report<br />
Other gains/losses<br />
Other gains were £1.7m, arising from a £1.0m one-off gain on the<br />
part disposal of our stake in Cofunds and a small net increase in<br />
the market value of our seed capital investments. This is £0.7m lower<br />
than the £2.4m in 2009.<br />
Amortisation of intangible assets<br />
Amortisation of £39.8m (2009: £39.8m) included £38.7m (2009:<br />
£38.7m) relating to intangible assets acquired as part of the MBO<br />
on 19 June 2007. These assets relate to the acquired investment<br />
management contracts and the <strong>Jupiter</strong> brand name, and are amortised<br />
on a straight line basis over seven and ten years respectively.<br />
Exceptional costs<br />
The Financial Services Compensation Scheme announced<br />
on 20 January 2011 that a second interim levy for <strong>2010</strong>/11 would be<br />
imposed on the industry for the costs of major investment failures<br />
such as Keydata Investment Services Limited. The cost to the Group<br />
is £5.2m and the full amount has been recognised in <strong>2010</strong>. This<br />
charge did not arise from any action taken or omission by the Group.<br />
The Group also recognised an exceptional cost for the year of £1.6m<br />
(2009: £nil) which relates to expenses associated with the Listing.<br />
Of the overall cost of Listing of £15.7m, £10.3m relating to the issue<br />
of new equity was written off against the share premium account and<br />
£3.8m of loan amendment fees are included within finance expense<br />
in the income statement.<br />
Finance expense<br />
Finance expenses decreased by £17.4m to £29.0m (2009: £46.4m).<br />
This includes £12.5m of non-recurring expenses relating to the MBO<br />
capital structure and £3.8m of expenses incurred to modify the terms<br />
of the bank loan in order to facilitate the Listing. After our Listing,<br />
finance costs have only been incurred on our £283.0m bank loan.<br />
Interest on this is paid at a margin of 3.75 per cent. over 3 month<br />
LIBOR, although the Group fixed its interest rate on £70m of the<br />
debt via swaps over three and four year periods with effect from<br />
1 November <strong>2010</strong>.<br />
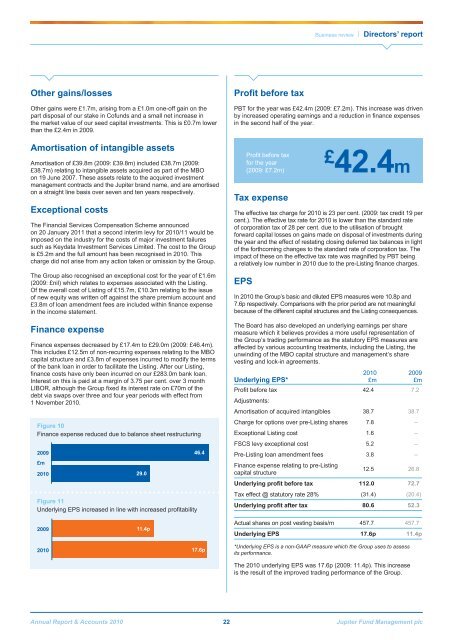
Figure 10<br />
Finance expense reduced due to balance sheet restructuring<br />
2009<br />
£m<br />
<strong>2010</strong><br />
29.0<br />
Figure 11<br />
Underlying EPS increased in line with increased profitability<br />
46.4<br />
Profit before tax<br />
PBT for the year was £42.4m (2009: £7.2m). This increase was driven<br />
by increased operating earnings and a reduction in finance expenses<br />
in the second half of the year.<br />
Tax expense<br />
The effective tax charge for <strong>2010</strong> is 23 per cent. (2009: tax credit 19 per<br />
cent.). The effective tax rate for <strong>2010</strong> is lower than the standard rate<br />
of corporation tax of 28 per cent. due to the utilisation of brought<br />
forward capital losses on gains made on disposal of investments during<br />
the year and the effect of restating closing deferred tax balances in light<br />
of the forthcoming changes to the standard rate of corporation tax. The<br />
impact of these on the effective tax rate was magnified by PBT being<br />
a relatively low number in <strong>2010</strong> due to the pre-Listing finance charges.<br />
EPS<br />
Profit before tax<br />
for the year<br />
(2009: £7.2m)<br />
£<br />
42.4m<br />
In <strong>2010</strong> the Group’s basic and diluted EPS measures were 10.8p and<br />
7.6p respectively. Comparisons with the prior period are not meaningful<br />
because of the different capital structures and the Listing consequences.<br />
The Board has also developed an underlying earnings per share<br />
measure which it believes provides a more useful representation of<br />
the Group’s trading performance as the statutory EPS measures are<br />
affected by various accounting treatments, including the Listing, the<br />
unwinding of the MBO capital structure and management’s share<br />
vesting and lock-in agreements.<br />
<strong>2010</strong><br />
2009<br />
Underlying EPS*<br />
£m<br />
£m<br />
Profit before tax 42.4 7.2<br />
Adjustments:<br />
Amortisation of acquired intangibles 38.7 38.7<br />
Charge for options over pre-Listing shares 7.8 –<br />
Exceptional Listing cost 1.6 –<br />
FSCS levy exceptional cost 5.2 –<br />
Pre-Listing loan amendment fees 3.8 –<br />
Finance expense relating to pre-Listing<br />
capital structure<br />
12.5 26.8<br />
Underlying profit before tax 112.0 72.7<br />
Tax effect @ statutory rate 28% (31.4) (20.4)<br />
Underlying profit after tax 80.6 52.3<br />
2009<br />
11.4p<br />
Actual shares on post vesting basis/m 457.7 457.7<br />
Underlying EPS 17.6p 11.4p<br />
<strong>2010</strong><br />
17.6p<br />
*Underlying EPS is a non-GAAP measure which the Group uses to assess<br />
its performance.<br />
The <strong>2010</strong> underlying EPS was 17.6p (2009: 11.4p). This increase<br />
is the result of the improved trading performance of the Group.<br />
<strong>Annual</strong> <strong>Report</strong> & Accounts <strong>2010</strong> 22 <strong>Jupiter</strong> Fund <strong>Management</strong> plc