Jupiter Annual Report 2010 - Jupiter Asset Management
Jupiter Annual Report 2010 - Jupiter Asset Management
Jupiter Annual Report 2010 - Jupiter Asset Management

You also want an ePaper? Increase the reach of your titles
YUMPU automatically turns print PDFs into web optimized ePapers that Google loves.
Financial statements – continuation | Notes to the financial statements<br />
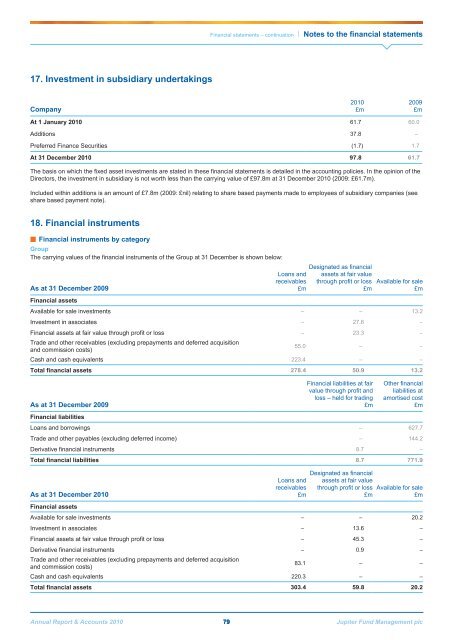
17. Investment in subsidiary undertakings<br />
Company<br />
<strong>2010</strong><br />
£m<br />
2009<br />
£m<br />
At 1 January <strong>2010</strong> 61.7 60.0<br />
Additions 37.8 –<br />
Preferred Finance Securities (1.7) 1.7<br />
At 31 December <strong>2010</strong> 97.8 61.7<br />
The basis on which the fixed asset investments are stated in these financial statements is detailed in the accounting policies. In the opinion of the<br />
Directors, the investment in subsidiary is not worth less than the carrying value of £97.8m at 31 December <strong>2010</strong> (2009: £61.7m).<br />
Included within additions is an amount of £7.8m (2009: £nil) relating to share based payments made to employees of subsidiary companies (see<br />
share based payment note).<br />
18. Financial instruments<br />
■■Financial instruments by category<br />
Group<br />
The carrying values of the financial instruments of the Group at 31 December is shown below:<br />
As at 31 December 2009<br />
Loans and<br />
receivables<br />
£m<br />
Designated as financial<br />
assets at fair value<br />
through profit or loss<br />
£m<br />
Available for sale<br />
£m<br />
Financial assets<br />
Available for sale investments – – 13.2<br />
Investment in associates – 27.6 –<br />
Financial assets at fair value through profit or loss – 23.3 –<br />
Trade and other receivables (excluding prepayments and deferred acquisition<br />
and commission costs)<br />
55.0 – –<br />
Cash and cash equivalents 223.4 – –<br />
Total financial assets 278.4 50.9 13.2<br />
As at 31 December 2009<br />
Financial liabilities at fair<br />
value through profit and<br />
loss – held for trading<br />
£m<br />
Other financial<br />
liabilities at<br />
amortised cost<br />
£m<br />
Financial liabilities<br />
Loans and borrowings – 627.7<br />
Trade and other payables (excluding deferred income) – 144.2<br />
Derivative financial instruments 8.7 –<br />
Total financial liabilities 8.7 771.9<br />
As at 31 December <strong>2010</strong><br />
Loans and<br />
receivables<br />
£m<br />
Designated as financial<br />
assets at fair value<br />
through profit or loss<br />
£m<br />
Available for sale<br />
£m<br />
Financial assets<br />
Available for sale investments – – 20.2<br />
Investment in associates – 13.6 –<br />
Financial assets at fair value through profit or loss – 45.3 –<br />
Derivative financial instruments – 0.9 –<br />
Trade and other receivables (excluding prepayments and deferred acquisition<br />
and commission costs)<br />
83.1 – –<br />
Cash and cash equivalents 220.3 – –<br />
Total financial assets 303.4 59.8 20.2<br />
<strong>Annual</strong> <strong>Report</strong> & Accounts <strong>2010</strong> 79 <strong>Jupiter</strong> Fund <strong>Management</strong> plc