Jupiter Annual Report 2010 - Jupiter Asset Management
Jupiter Annual Report 2010 - Jupiter Asset Management
Jupiter Annual Report 2010 - Jupiter Asset Management

You also want an ePaper? Increase the reach of your titles
YUMPU automatically turns print PDFs into web optimized ePapers that Google loves.
Strategy & Key performance indicators | Who we are<br />
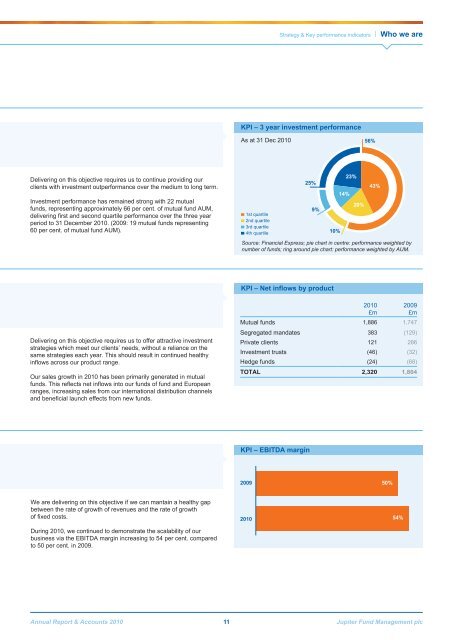
KPI – 3 year investment performance<br />
As at 31 Dec <strong>2010</strong><br />
56%<br />
Delivering on this objective requires us to continue providing our<br />
clients with investment outperformance over the medium to long term.<br />
Investment performance has remained strong with 22 mutual<br />
funds, representing approximately 66 per cent. of mutual fund AUM,<br />
delivering first and second quartile performance over the three year<br />
period to 31 December <strong>2010</strong>. (2009: 19 mutual funds representing<br />
60 per cent. of mutual fund AUM).<br />
1st quartile<br />
2nd quartile<br />
3rd quartile<br />
4th quartile<br />
25%<br />
9%<br />
10%<br />
14%<br />
23%<br />
20%<br />
43%<br />
Source: Financial Express; pie chart in centre: performance weighted by<br />
number of funds; ring around pie chart: performance weighted by AUM.<br />
KPI – Net inflows by product<br />
Delivering on this objective requires us to offer attractive investment<br />
strategies which meet our clients’ needs, without a reliance on the<br />
same strategies each year. This should result in continued healthy<br />
inflows across our product range.<br />
Our sales growth in <strong>2010</strong> has been primarily generated in mutual<br />
funds. This reflects net inflows into our funds of fund and European<br />
ranges, increasing sales from our international distribution channels<br />
and beneficial launch effects from new funds.<br />
<strong>2010</strong><br />
£m<br />
2009<br />
£m<br />
Mutual funds 1,886 1,747<br />
Segregated mandates 383 (129)<br />
Private clients 121 286<br />
Investment trusts (46) (32)<br />
Hedge funds (24) (68)<br />
TOTAL 2,320 1,804<br />
KPI – EBITDA margin<br />
2009<br />
50%<br />
We are delivering on this objective if we can mantain a healthy gap<br />
between the rate of growth of revenues and the rate of growth<br />
of fixed costs.<br />
During <strong>2010</strong>, we continued to demonstrate the scalability of our<br />
business via the EBITDA margin increasing to 54 per cent. compared<br />
to 50 per cent. in 2009.<br />
<strong>2010</strong><br />
54%<br />
<strong>Annual</strong> <strong>Report</strong> & Accounts <strong>2010</strong> 11 <strong>Jupiter</strong> Fund <strong>Management</strong> plc