Jupiter Annual Report 2010 - Jupiter Asset Management
Jupiter Annual Report 2010 - Jupiter Asset Management
Jupiter Annual Report 2010 - Jupiter Asset Management

You also want an ePaper? Increase the reach of your titles
YUMPU automatically turns print PDFs into web optimized ePapers that Google loves.
Historical summary | Other information<br />
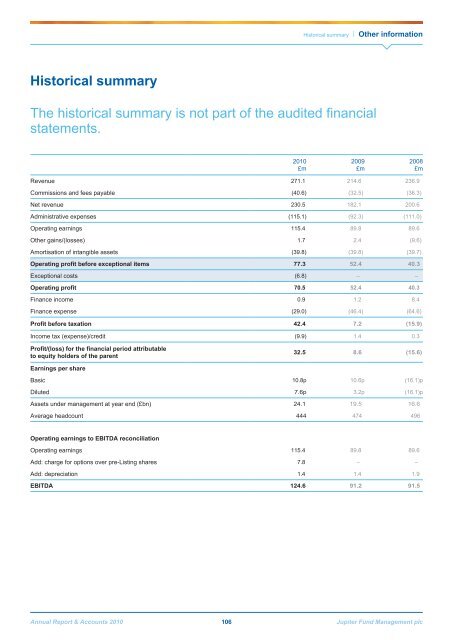
Historical summary<br />
The historical summary is not part of the audited financial<br />
statements.<br />
<strong>2010</strong><br />
£m<br />
2009<br />
£m<br />
2008<br />
£m<br />
Revenue 271.1 214.6 236.9<br />
Commissions and fees payable (40.6) (32.5) (36.3)<br />
Net revenue 230.5 182.1 200.6<br />
Administrative expenses (115.1) (92.3) (111.0)<br />
Operating earnings 115.4 89.8 89.6<br />
Other gains/(losses) 1.7 2.4 (9.6)<br />
Amortisation of intangible assets (39.8) (39.8) (39.7)<br />
Operating profit before exceptional items 77.3 52.4 40.3<br />
Exceptional costs (6.8) – –<br />
Operating profit 70.5 52.4 40.3<br />
Finance income 0.9 1.2 8.4<br />
Finance expense (29.0) (46.4) (64.6)<br />
Profit before taxation 42.4 7.2 (15.9)<br />
Income tax (expense)/credit (9.9) 1.4 0.3<br />
Profit/(loss) for the financial period attributable<br />
to equity holders of the parent<br />
32.5 8.6 (15.6)<br />
Earnings per share<br />
Basic 10.8p 10.6p (16.1)p<br />
Diluted 7.6p 3.2p (16.1)p<br />
<strong>Asset</strong>s under management at year end (£bn) 24.1 19.5 16.6<br />
Average headcount 444 474 496<br />
Operating earnings to EBITDA reconciliation<br />
Operating earnings 115.4 89.8 89.6<br />
Add: charge for options over pre-Listing shares 7.8 – –<br />
Add: depreciation 1.4 1.4 1.9<br />
EBITDA 124.6 91.2 91.5<br />
<strong>Annual</strong> <strong>Report</strong> & Accounts <strong>2010</strong> 106 <strong>Jupiter</strong> Fund <strong>Management</strong> plc