Emerging Trends in Real Estate 2012 - Urban Land Institute
Emerging Trends in Real Estate 2012 - Urban Land Institute
Emerging Trends in Real Estate 2012 - Urban Land Institute

Create successful ePaper yourself
Turn your PDF publications into a flip-book with our unique Google optimized e-Paper software.
Chapter 2: Capital Flows<br />
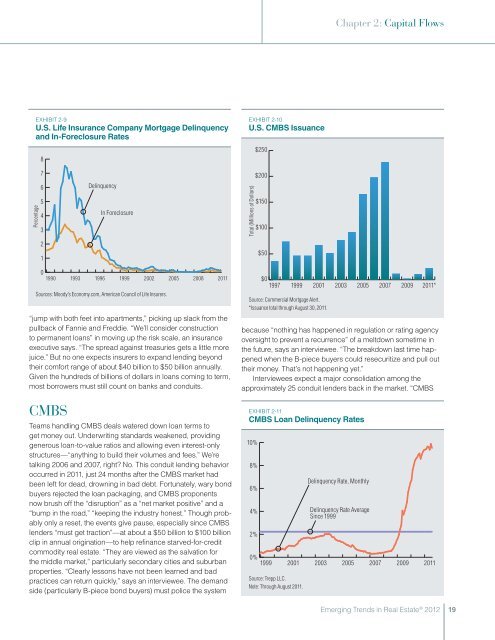
Exhibit 2-9<br />
U.S. Life Insurance Company Mortgage Del<strong>in</strong>quency<br />
and In-Foreclosure Rates<br />
8<br />
Exhibit 2-10<br />
U.S. CMBS Issuance<br />
$250<br />
Percentage<br />
7<br />
6<br />
5<br />
4<br />
3<br />
2<br />
1<br />
Del<strong>in</strong>quency<br />
In Foreclosure<br />
Total (Millions of Dollars)<br />
$200<br />
$150<br />
$100<br />
$50<br />
0<br />
1990<br />
1993<br />
1996<br />
1999<br />
2002<br />
Sources: Moody’s Economy.com, American Council of Life Insurers.<br />
2005<br />
2008<br />
“jump with both feet <strong>in</strong>to apartments,” pick<strong>in</strong>g up slack from the<br />
pullback of Fannie and Freddie. “We’ll consider construction<br />
to permanent loans” <strong>in</strong> mov<strong>in</strong>g up the risk scale, an <strong>in</strong>surance<br />
executive says. “The spread aga<strong>in</strong>st treasuries gets a little more<br />
juice.” But no one expects <strong>in</strong>surers to expand lend<strong>in</strong>g beyond<br />
their comfort range of about $40 billion to $50 billion annually.<br />
Given the hundreds of billions of dollars <strong>in</strong> loans com<strong>in</strong>g to term,<br />
most borrowers must still count on banks and conduits.<br />
2011<br />
$0<br />
1997<br />
1999<br />
2001<br />
Source: Commercial Mortgage Alert.<br />
*Issuance total through August 30, 2011.<br />
2003<br />
2005<br />
2007<br />
2009<br />
2011*<br />
because “noth<strong>in</strong>g has happened <strong>in</strong> regulation or rat<strong>in</strong>g agency<br />
oversight to prevent a recurrence” of a meltdown sometime <strong>in</strong><br />
the future, says an <strong>in</strong>terviewee. “The breakdown last time happened<br />
when the B-piece buyers could resecuritize and pull out<br />
their money. That’s not happen<strong>in</strong>g yet.”<br />
Interviewees expect a major consolidation among the<br />
approximately 25 conduit lenders back <strong>in</strong> the market. “CMBS<br />
CMBS<br />
Teams handl<strong>in</strong>g CMBS deals watered down loan terms to<br />
get money out. Underwrit<strong>in</strong>g standards weakened, provid<strong>in</strong>g<br />
generous loan-to-value ratios and allow<strong>in</strong>g even <strong>in</strong>terest-only<br />
structures—“anyth<strong>in</strong>g to build their volumes and fees.” We’re<br />
talk<strong>in</strong>g 2006 and 2007, right No. This conduit lend<strong>in</strong>g behavior<br />
occurred <strong>in</strong> 2011, just 24 months after the CMBS market had<br />
been left for dead, drown<strong>in</strong>g <strong>in</strong> bad debt. Fortunately, wary bond<br />
buyers rejected the loan packag<strong>in</strong>g, and CMBS proponents<br />
now brush off the “disruption” as a “net market positive” and a<br />
“bump <strong>in</strong> the road,” “keep<strong>in</strong>g the <strong>in</strong>dustry honest.” Though probably<br />
only a reset, the events give pause, especially s<strong>in</strong>ce CMBS<br />
lenders “must get traction”—at about a $50 billion to $100 billion<br />
clip <strong>in</strong> annual orig<strong>in</strong>ation—to help ref<strong>in</strong>ance starved-for-credit<br />
commodity real estate. “They are viewed as the salvation for<br />
the middle market,” particularly secondary cities and suburban<br />
properties. “Clearly lessons have not been learned and bad<br />
practices can return quickly,” says an <strong>in</strong>terviewee. The demand<br />
side (particularly B-piece bond buyers) must police the system<br />
Exhibit 2-11<br />
CMBS Loan Del<strong>in</strong>quency Rates<br />
10%<br />
8%<br />
6%<br />
4%<br />
2%<br />
0%<br />
1999<br />
2001<br />
Source: Trepp LLC.<br />
Note: Through August 2011.<br />
Del<strong>in</strong>quency Rate, Monthly<br />
Del<strong>in</strong>quency Rate Average<br />
S<strong>in</strong>ce 1999<br />
2003<br />
2005<br />
2007<br />
2009<br />
2011<br />
<strong>Emerg<strong>in</strong>g</strong> <strong>Trends</strong> <strong>in</strong> <strong>Real</strong> <strong>Estate</strong> ® <strong>2012</strong><br />
19