Science Research Program Guide - Secondary Programs Home ...
Science Research Program Guide - Secondary Programs Home ...
Science Research Program Guide - Secondary Programs Home ...

Create successful ePaper yourself
Turn your PDF publications into a flip-book with our unique Google optimized e-Paper software.
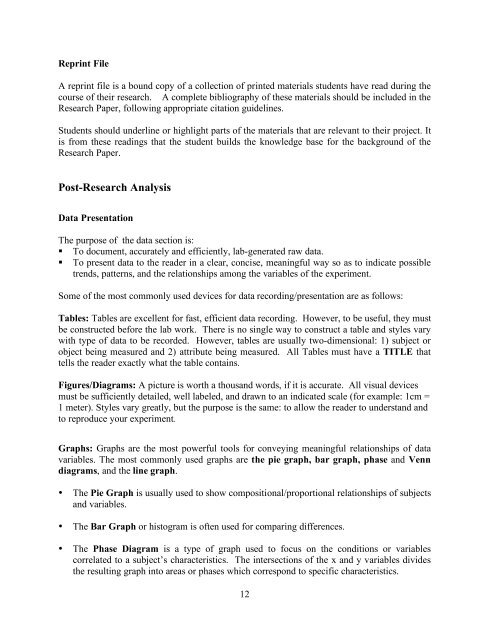
Reprint File<br />
A reprint file is a bound copy of a collection of printed materials students have read during the<br />
course of their research. A complete bibliography of these materials should be included in the<br />
<strong>Research</strong> Paper, following appropriate citation guidelines.<br />
Students should underline or highlight parts of the materials that are relevant to their project. It<br />
is from these readings that the student builds the knowledge base for the background of the<br />
<strong>Research</strong> Paper.<br />
Post-<strong>Research</strong> Analysis<br />
Data Presentation<br />
The purpose of the data section is:<br />
� To document, accurately and efficiently, lab-generated raw data.<br />
� To present data to the reader in a clear, concise, meaningful way so as to indicate possible<br />
trends, patterns, and the relationships among the variables of the experiment.<br />
Some of the most commonly used devices for data recording/presentation are as follows:<br />
Tables: Tables are excellent for fast, efficient data recording. However, to be useful, they must<br />
be constructed before the lab work. There is no single way to construct a table and styles vary<br />
with type of data to be recorded. However, tables are usually two-dimensional: 1) subject or<br />
object being measured and 2) attribute being measured. All Tables must have a TITLE that<br />
tells the reader exactly what the table contains.<br />
Figures/Diagrams: A picture is worth a thousand words, if it is accurate. All visual devices<br />
must be sufficiently detailed, well labeled, and drawn to an indicated scale (for example: 1cm =<br />
1 meter). Styles vary greatly, but the purpose is the same: to allow the reader to understand and<br />
to reproduce your experiment.<br />
Graphs: Graphs are the most powerful tools for conveying meaningful relationships of data<br />
variables. The most commonly used graphs are the pie graph, bar graph, phase and Venn<br />
diagrams, and the line graph.<br />
• The Pie Graph is usually used to show compositional/proportional relationships of subjects<br />
and variables.<br />
• The Bar Graph or histogram is often used for comparing differences.<br />
• The Phase Diagram is a type of graph used to focus on the conditions or variables<br />
correlated to a subject’s characteristics. The intersections of the x and y variables divides<br />
the resulting graph into areas or phases which correspond to specific characteristics.<br />
12