

MARKET MOVER - BNP PARIBAS - Investment Services India
MARKET MOVER - BNP PARIBAS - Investment Services India
MARKET MOVER - BNP PARIBAS - Investment Services India

Create successful ePaper yourself
Turn your PDF publications into a flip-book with our unique Google optimized e-Paper software.
EUR: Outlook for the Curve<br />
• The Fed has clearly opened the door for<br />
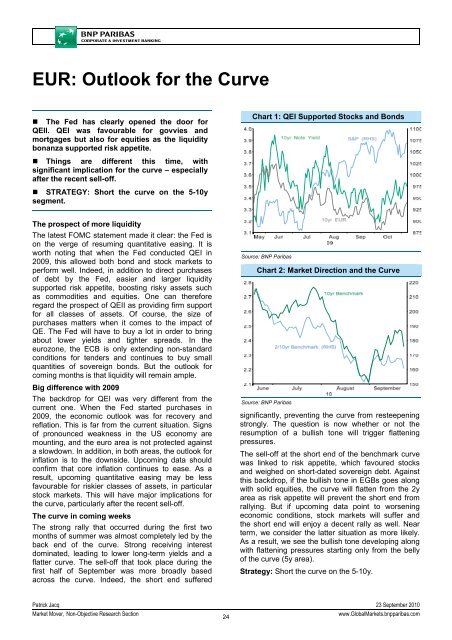
QEII. QEI was favourable for govvies and<br />
mortgages but also for equities as the liquidity<br />
bonanza supported risk appetite.<br />
Chart 1: QEI Supported Stocks and Bonds<br />
• Things are different this time, with<br />
significant implication for the curve – especially<br />
after the recent sell-off.<br />
• STRATEGY: Short the curve on the 5-10y<br />
segment.<br />
The prospect of more liquidity<br />
The latest FOMC statement made it clear: the Fed is<br />
on the verge of resuming quantitative easing. It is<br />
worth noting that when the Fed conducted QEI in<br />
2009, this allowed both bond and stock markets to<br />
perform well. Indeed, in addition to direct purchases<br />
of debt by the Fed, easier and larger liquidity<br />
supported risk appetite, boosting risky assets such<br />
as commodities and equities. One can therefore<br />
regard the prospect of QEII as providing firm support<br />
for all classes of assets. Of course, the size of<br />
purchases matters when it comes to the impact of<br />
QE. The Fed will have to buy a lot in order to bring<br />
about lower yields and tighter spreads. In the<br />
eurozone, the ECB is only extending non-standard<br />
conditions for tenders and continues to buy small<br />
quantities of sovereign bonds. But the outlook for<br />
coming months is that liquidity will remain ample.<br />
Big difference with 2009<br />
The backdrop for QEI was very different from the<br />
current one. When the Fed started purchases in<br />
2009, the economic outlook was for recovery and<br />
reflation. This is far from the current situation. Signs<br />
of pronounced weakness in the US economy are<br />
mounting, and the euro area is not protected against<br />
a slowdown. In addition, in both areas, the outlook for<br />
inflation is to the downside. Upcoming data should<br />
confirm that core inflation continues to ease. As a<br />
result, upcoming quantitative easing may be less<br />
favourable for riskier classes of assets, in particular<br />
stock markets. This will have major implications for<br />
the curve, particularly after the recent sell-off.<br />
The curve in coming weeks<br />
The strong rally that occurred during the first two<br />
months of summer was almost completely led by the<br />
back end of the curve. Strong receiving interest<br />
dominated, leading to lower long-term yields and a<br />
flatter curve. The sell-off that took place during the<br />
first half of September was more broadly based<br />
across the curve. Indeed, the short end suffered<br />
Source: <strong>BNP</strong> Paribas<br />
Chart 2: Market Direction and the Curve<br />
Source: <strong>BNP</strong> Paribas<br />
significantly, preventing the curve from resteepening<br />
strongly. The question is now whether or not the<br />
resumption of a bullish tone will trigger flattening<br />
pressures.<br />
The sell-off at the short end of the benchmark curve<br />
was linked to risk appetite, which favoured stocks<br />
and weighed on short-dated sovereign debt. Against<br />
this backdrop, if the bullish tone in EGBs goes along<br />
with solid equities, the curve will flatten from the 2y<br />
area as risk appetite will prevent the short end from<br />
rallying. But if upcoming data point to worsening<br />
economic conditions, stock markets will suffer and<br />
the short end will enjoy a decent rally as well. Near<br />
term, we consider the latter situation as more likely.<br />
As a result, we see the bullish tone developing along<br />
with flattening pressures starting only from the belly<br />
of the curve (5y area).<br />
Strategy: Short the curve on the 5-10y.<br />
Patrick Jacq 23 September 2010<br />
Market Mover, Non-Objective Research Section<br />
24<br />
www.GlobalMarkets.bnpparibas.com


