

MARKET MOVER - BNP PARIBAS - Investment Services India
MARKET MOVER - BNP PARIBAS - Investment Services India
MARKET MOVER - BNP PARIBAS - Investment Services India

Create successful ePaper yourself
Turn your PDF publications into a flip-book with our unique Google optimized e-Paper software.
Next we compare Ireland and Portugal and try to<br />
identify the potential threats and opportunities in the<br />
coming months. Starting with the funding needs and<br />
issuance calendar in these countries, Ireland has<br />
already reached 2010’s funding needs and has<br />
actually started pre-funding for 2011. Despite that,<br />
NTMA officials have stated that there is no plan to<br />
skip an auction and thus we could have some more<br />
prefunding in the remainder of the year, most likely<br />
two more auctions (depending on market conditions).<br />
On the other hand, Portugal has completed 90% of<br />
its issuance target (EUR 19bn of EUR 21bn) and we<br />
expect another EUR 2bn before year-end. Hence,<br />
funding pressures will be limited in the remainder of<br />
the year while the main focus will be on the budget<br />
reports and the projections for 2011 funding needs.<br />
In terms of fiscal consolidation, Portugal appears to<br />
be on a weaker path. Chart 4 shows the Portuguese<br />
cash-basis budget balance, where the development<br />
has been disappointing so far according to our<br />
economists. Over the first eight months of this year,<br />
the deficit was EUR 0.5bn larger than over the same<br />
period last year. On the contrary, in Ireland, there<br />
have been many concerns lately with respect to the<br />
massive amount of government guaranteed bonds<br />
that mature in September. This has led to an<br />
acceleration of the widening of Irish spreads in<br />
combination with the developments on ANGIRI. We<br />
don’t think that these redemptions will cause any<br />
significant problem for the Irish banks and we expect<br />
some risk to be priced out of Irish Gilts once<br />
September has passed. The key statistic to watch in<br />
the near term will be the ECB liquidity absorbed by<br />
Irish banks, where we could see a spike in<br />
September’s data. This spike has already taken<br />
place in Portugal: as Chart 5 shows, the dependence<br />
of Portuguese banks on the ECB has exploded since<br />
April. This is a very worrying trend that could create<br />
more pressure on PGBs as the ECB’s exit strategy<br />
has already become a hot topic in the market.<br />
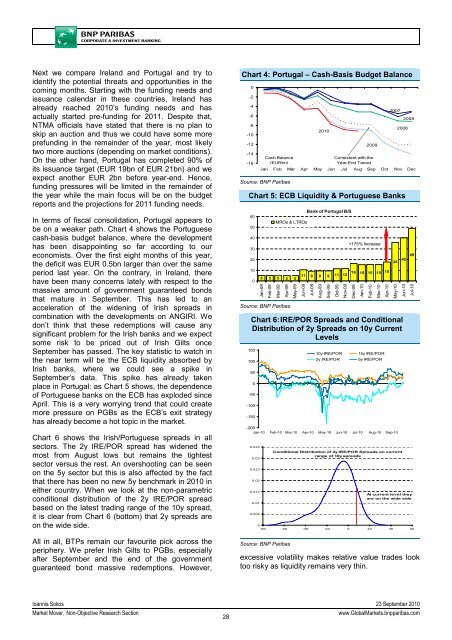
Chart 6 shows the Irish/Portuguese spreads in all<br />
sectors. The 2y IRE/POR spread has widened the<br />
most from August lows but remains the tightest<br />
sector versus the rest. An overshooting can be seen<br />
on the 5y sector but this is also affected by the fact<br />
that there has been no new 5y benchmark in 2010 in<br />
either country. When we look at the non-parametric<br />
conditional distribution of the 2y IRE/POR spread<br />
based on the latest trading range of the 10y spread,<br />
it is clear from Chart 6 (bottom) that 2y spreads are<br />
on the wide side.<br />
All in all, BTPs remain our favourite pick across the<br />
periphery. We prefer Irish Gilts to PGBs, especially<br />
after September and the end of the government<br />
guaranteed bond massive redemptions. However,<br />
Chart 4: Portugal – Cash-Basis Budget Balance<br />
0<br />
-2<br />
-4<br />
-6<br />
-8<br />
-10<br />
-12<br />
-14<br />
-16<br />
Cash Balance<br />
(EURbn)<br />
2010<br />
2009<br />
Consistent with the<br />
Year-End Target<br />
2007<br />
2006<br />
2008<br />
Jan Feb Mar Apr May Jun Jul Aug Sep Oct Nov Dec<br />
Source: <strong>BNP</strong> Paribas<br />
Chart 5: ECB Liquidity & Portuguese Banks<br />
60<br />
50<br />
40<br />
30<br />
20<br />
10<br />
0<br />
5 5 5 5 5<br />
Jan-09<br />
Feb-09<br />
Mar-09<br />
Apr-09<br />
Source: <strong>BNP</strong> Paribas<br />
MROs & LTROs<br />
May-09<br />
Bank of Portugal B/S<br />
11 9 9 9 11 12 16 15 15 15 18 36 40 49<br />
Jun-09<br />
Jul-09<br />
Aug-09<br />
Sep-09<br />
excessive volatility makes relative value trades look<br />
too risky as liquidity remains very thin.<br />
Oct-09<br />
Nov-09<br />
+175% Increase<br />
Chart 6: IRE/POR Spreads and Conditional<br />
Distribution of 2y Spreads on 10y Current<br />
Levels<br />
150<br />
100<br />
50<br />
0<br />
-50<br />
-100<br />
-150<br />
-200<br />
Jan-10 Feb-10 Mar-10 Apr-10 May-10 Jun-10 Jul-10 Aug-10 Sep-10<br />
0.035<br />
0.03<br />
0.025<br />
0.02<br />
0.015<br />
0.01<br />
0.005<br />
0<br />
10y IRE/POR<br />
2y IRE/POR<br />
Dec-09<br />
Jan-10<br />
Feb-10<br />
Mar-10<br />
15y IRE/POR<br />
5y IRE/POR<br />
-80 -60 -40 -20 0 20 40 60<br />
Source: <strong>BNP</strong> Paribas<br />
Conditional Distribution of 2y IRE/POR Spreads on current<br />
range of 10y spreads<br />
Apr-10<br />
May-10<br />
Jun-10<br />
Jul-10<br />
At current level they<br />
are on the wide side<br />
Ioannis Sokos 23 September 2010<br />
Market Mover, Non-Objective Research Section<br />
28<br />
www.GlobalMarkets.bnpparibas.com


