Pharmaceutical Technology: Controlled Drug Release, Volume 2
Pharmaceutical Technology: Controlled Drug Release, Volume 2
Pharmaceutical Technology: Controlled Drug Release, Volume 2

You also want an ePaper? Increase the reach of your titles
YUMPU automatically turns print PDFs into web optimized ePapers that Google loves.
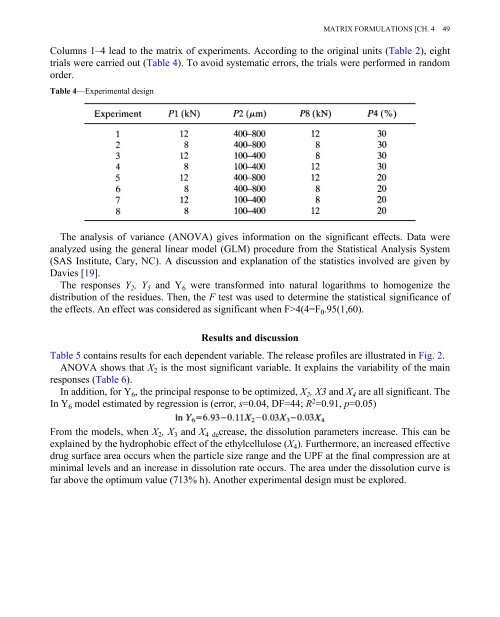
Columns 1–4 lead to the matrix of experiments. According to the original units (Table 2), eight<br />
trials were carried out (Table 4). To avoid systematic errors, the trials were performed in random<br />
order.<br />
Table 4—Experimental design<br />
MATRIX FORMULATIONS [CH. 4 49<br />
The analysis of variance (ANOVA) gives information on the significant effects. Data were<br />
analyzed using the general linear model (GLM) procedure from the Statistical Analysis System<br />
(SAS Institute, Cary, NC). A discussion and explanation of the statistics involved are given by<br />
Davies [19].<br />
The responses Y 2 , Y 5 and Y 6 were transformed into natural logarithms to homogenize the<br />
distribution of the residues. Then, the F test was used to determine the statistical significance of<br />
the effects. An effect was considered as significant when F>4(4=F 0 .95(1,60).<br />
Results and discussion<br />
Table 5 contains results for each dependent variable. The release profiles are illustrated in Fig. 2.<br />
ANOVA shows that X 2 is the most significant variable. It explains the variability of the main<br />
responses (Table 6).<br />
In addition, for Y 6 , the principal response to be optimized, X 2 , X3 and X 4 are all significant. The<br />
In Y 6 model estimated by regression is (error, s=0.04, DF=44; R 2 =0.91, p=0.05)<br />
From the models, when X 2 , X 3 and X 4 de crease, the dissolution parameters increase. This can be<br />
explained by the hydrophobic effect of the ethylcellulose (X 4 ). Furthermore, an increased effective<br />
drug surface area occurs when the particle size range and the UPF at the final compression are at<br />
minimal levels and an increase in dissolution rate occurs. The area under the dissolution curve is<br />
far above the optimum value (713% h). Another experimental design must be explored.