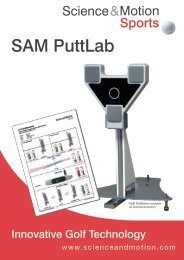
SAM PuttLab Operating Manual - Science & Motion Golf
SAM PuttLab Operating Manual - Science & Motion Golf
SAM PuttLab Operating Manual - Science & Motion Golf

Create successful ePaper yourself
Turn your PDF publications into a flip-book with our unique Google optimized e-Paper software.
Functionality of <strong>SAM</strong> <strong>PuttLab</strong><br />
Data registration<br />
The positional data of the movements is recorded using the <strong>SAM</strong><br />
<strong>Motion</strong>Analyzer movement registration system. In this measuring<br />
system the positions of miniature ultrasonic transmitters are<br />
sampled at a maximum frequency of 210 Hz (total for all markers<br />
used) at a spatial resolution of about 0.1 mm. Before data analysis<br />
the raw positional data is filtered using specially designed filter<br />
procedures.<br />
Automatic segmentation<br />
During data recording a data tracer is automatically identifies<br />
single strokes from the data flow. For each identified valid stroke<br />
an automatic segmentation is calculated to divide the movement<br />
into relevant movement segments. The movement data and the<br />
segmentation information are then stored on the computer. Based<br />
on the data segmentation up to 28 different movement parameters<br />
and their distribution in movement repetition can be analyzed.<br />
Analysis<br />
<strong>SAM</strong> PuttWare software includes extensive graphical and statistical<br />
tools to analyze the movement data. Single strokes can be easily<br />
selected from the recorded data. The movement characteristics<br />
can be inspected in different plots. All data values and differences<br />
are displayed on the screen and can be saved to a file.<br />
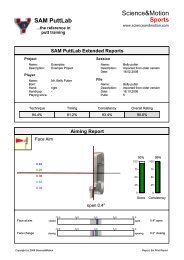
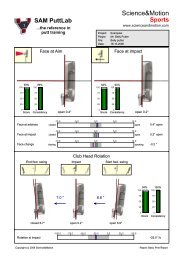
Graphic Reports<br />
<strong>SAM</strong> PuttWare provides powerful graphic reports with multiple<br />
graphs, texts, and boxes. The high resolution graphical reports<br />
allow clear illustration and documentation of the individual<br />
movement performance. Graphic reports can be created for screen<br />
display or for print out and are available for different performance<br />
levels. The reports can also be converted to PDF-format and saved<br />
to file.<br />
Competence profiles<br />
A special software module allows displaying the data in bar charts<br />
on uniform scales. The transformation of the parameters to z-<br />
values allows a direct comparison of movement performance for<br />
Page 10