SAM PuttLab Operating Manual - Science & Motion Golf
SAM PuttLab Operating Manual - Science & Motion Golf
SAM PuttLab Operating Manual - Science & Motion Golf

Create successful ePaper yourself
Turn your PDF publications into a flip-book with our unique Google optimized e-Paper software.
Extended data analysis functions<br />
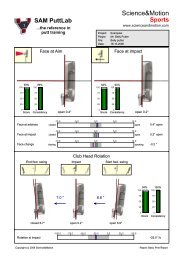
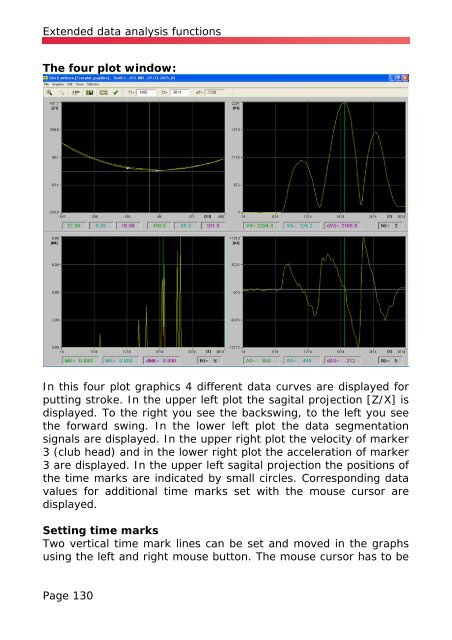
The four plot window:<br />
In this four plot graphics 4 different data curves are displayed for<br />
putting stroke. In the upper left plot the sagital projection [Z/X] is<br />
displayed. To the right you see the backswing, to the left you see<br />
the forward swing. In the lower left plot the data segmentation<br />
signals are displayed. In the upper right plot the velocity of marker<br />
3 (club head) and in the lower right plot the acceleration of marker<br />
3 are displayed. In the upper left sagital projection the positions of<br />
the time marks are indicated by small circles. Corresponding data<br />
values for additional time marks set with the mouse cursor are<br />
displayed.<br />
Setting time marks<br />
Two vertical time mark lines can be set and moved in the graphs<br />
using the left and right mouse button. The mouse cursor has to be<br />
Page 130