SAM PuttLab Operating Manual - Science & Motion Golf
SAM PuttLab Operating Manual - Science & Motion Golf
SAM PuttLab Operating Manual - Science & Motion Golf

Create successful ePaper yourself
Turn your PDF publications into a flip-book with our unique Google optimized e-Paper software.
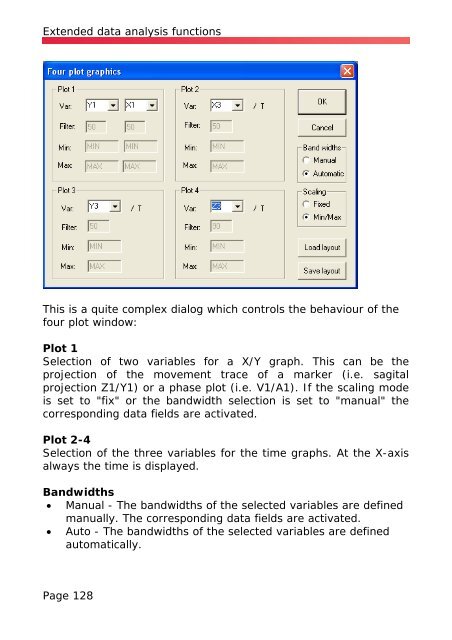
Extended data analysis functions<br />
This is a quite complex dialog which controls the behaviour of the<br />
four plot window:<br />
Plot 1<br />
Selection of two variables for a X/Y graph. This can be the<br />
projection of the movement trace of a marker (i.e. sagital<br />
projection Z1/Y1) or a phase plot (i.e. V1/A1). If the scaling mode<br />
is set to "fix" or the bandwidth selection is set to "manual" the<br />
corresponding data fields are activated.<br />
Plot 2-4<br />
Selection of the three variables for the time graphs. At the X-axis<br />
always the time is displayed.<br />
Bandwidths<br />
• <strong>Manual</strong> - The bandwidths of the selected variables are defined<br />
manually. The corresponding data fields are activated.<br />
• Auto - The bandwidths of the selected variables are defined<br />
automatically.<br />
Page 128