Condit Dam Removal Condit Dam Removal - Access Washington
Condit Dam Removal Condit Dam Removal - Access Washington
Condit Dam Removal Condit Dam Removal - Access Washington

Create successful ePaper yourself
Turn your PDF publications into a flip-book with our unique Google optimized e-Paper software.
<strong>Condit</strong> <strong>Dam</strong> Hydroelectric Project<br />
Final Supplemental EIS<br />
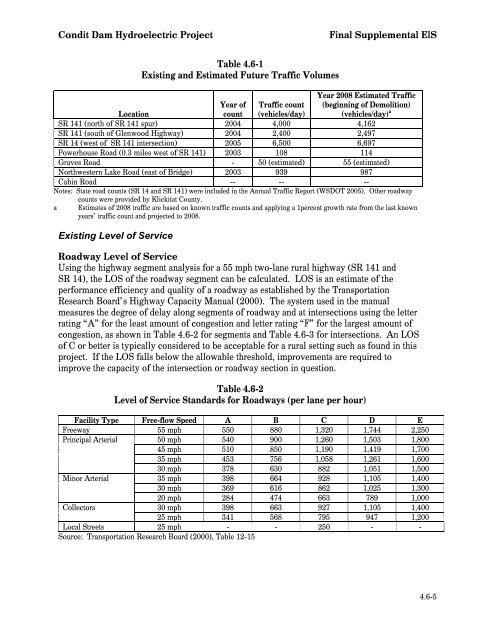
Table 4.6-1<br />
Existing and Estimated Future Traffic Volumes<br />
Location<br />
Year of<br />
count<br />
Traffic count<br />
(vehicles/day)<br />
Year 2008 Estimated Traffic<br />
(beginning of Demolition)<br />
(vehicles/day) a<br />
SR 141 (north of SR 141 spur) 2004 4,000 4,162<br />
SR 141 (south of Glenwood Highway) 2004 2,400 2,497<br />
SR 14 (west of SR 141 intersection) 2005 6,500 6,697<br />
Powerhouse Road (0.3 miles west of SR 141) 2003 108 114<br />
Graves Road - 50 (estimated) 55 (estimated)<br />
Northwestern Lake Road (east of Bridge) 2003 939 987<br />
Cabin Road -- -- --<br />
Notes: State road counts (SR 14 and SR 141) were included in the Annual Traffic Report (WSDOT 2005). Other roadway<br />
counts were provided by Klickitat County.<br />
a Estimates of 2008 traffic are based on known traffic counts and applying a 1percent growth rate from the last known<br />
years’ traffic count and projected to 2008.<br />
Existing Level of Service<br />
Roadway Level of Service<br />
Using the highway segment analysis for a 55 mph two-lane rural highway (SR 141 and<br />
SR 14), the LOS of the roadway segment can be calculated. LOS is an estimate of the<br />
performance efficiency and quality of a roadway as established by the Transportation<br />
Research Board’s Highway Capacity Manual (2000). The system used in the manual<br />
measures the degree of delay along segments of roadway and at intersections using the letter<br />
rating “A” for the least amount of congestion and letter rating “F” for the largest amount of<br />
congestion, as shown in Table 4.6-2 for segments and Table 4.6-3 for intersections. An LOS<br />
of C or better is typically considered to be acceptable for a rural setting such as found in this<br />
project. If the LOS falls below the allowable threshold, improvements are required to<br />
improve the capacity of the intersection or roadway section in question.<br />
Table 4.6-2<br />
Level of Service Standards for Roadways (per lane per hour)<br />
Facility Type Free-flow Speed A B C D E<br />
Freeway 55 mph 550 880 1,320 1,744 2,250<br />
Principal Arterial 50 mph 540 900 1,260 1,503 1,800<br />
45 mph 510 850 1,190 1,419 1,700<br />
35 mph 453 756 1,058 1,261 1,600<br />
30 mph 378 630 882 1,051 1,500<br />
Minor Arterial 35 mph 398 664 928 1,105 1,400<br />
30 mph 369 616 862 1,025 1,300<br />
20 mph 284 474 663 789 1,000<br />
Collectors 30 mph 398 663 927 1,105 1,400<br />
25 mph 341 568 795 947 1,200<br />
Local Streets 25 mph - - 250 - -<br />
Source: Transportation Research Board (2000), Table 12-15<br />
4.6-5