Chapter 3 Decision Support Model (IUWS-DSM) - Tubdok
Chapter 3 Decision Support Model (IUWS-DSM) - Tubdok
Chapter 3 Decision Support Model (IUWS-DSM) - Tubdok

Create successful ePaper yourself
Turn your PDF publications into a flip-book with our unique Google optimized e-Paper software.
28 New Conception and <strong>Decision</strong> <strong>Support</strong> <strong>Model</strong> for <strong>IUWS</strong><br />
equivalent water consumption, i.e. m 3 /(cap·d), and the other is the unit equivalent water<br />
consumption, i.e. m 3 /(unit·d). This unit can be area, volume, or number of products, etc.,<br />
depending on the types of the end-user. For example, the EUWUP of shopping centre can<br />
be estimated either based on its costumer capacity (i.e. m 3 /(passenger·d) ) or construction<br />
area (i.e. m 3 /(m 2 ·d) ). Afterwards, the general water quality-quantity-ratio is used so that the<br />
water amount can be allocated to different types of desired water quality. The equivalent<br />
average water consumption and the quality-quantity-ratio are obtained from the statistical<br />
data and are localised.<br />
2.2.1.3 estimation<br />
In the hierarchy of the <strong>IUWS</strong>, the estimation of water usage starts from WUC and WUU.<br />
As UD consists of WUUs, the water usage of UD is the summation of its WUUs. Likewise,<br />
the water usage of CA is calculated by summing the water usage of all UDs.<br />
As discussed above, EUWUP for each type of WUU and WUC should be established and<br />
stored in the database, so that the water usage is automatically calculated after inputing the<br />
planning information of WUU and WUC. Depending on the requirements, several water<br />
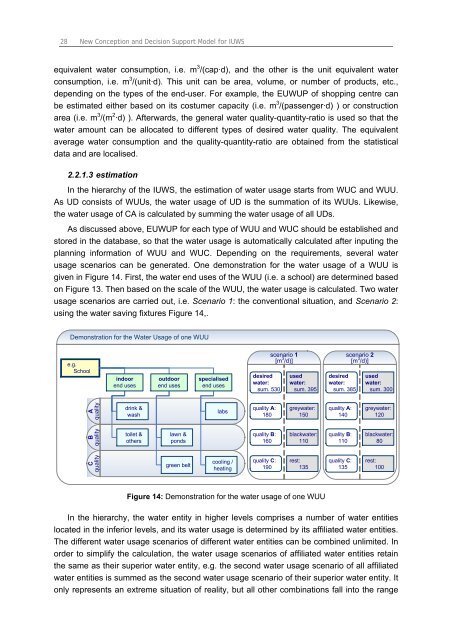
usage scenarios can be generated. One demonstration for the water usage of a WUU is<br />
given in Figure 14. First, the water end uses of the WUU (i.e. a school) are determined based<br />
on Figure 13. Then based on the scale of the WUU, the water usage is calculated. Two water<br />
usage scenarios are carried out, i.e. Scenario 1: the conventional situation, and Scenario 2:<br />
using the water saving fixtures Figure 14,.<br />
Demonstration for the Water Usage of one WUU<br />
e.g.<br />
School<br />
A<br />
quality<br />
B<br />
quality<br />
C<br />
quality<br />
indoor<br />
end uses<br />
drink &<br />
wash<br />
toilet &<br />
others<br />
outdoor<br />
end uses<br />
lawn &<br />
ponds<br />
green belt<br />
specialised<br />
end uses<br />
labs<br />
cooling /<br />
heating<br />
desired<br />
water:<br />
sum. 530<br />
quality A:<br />
180<br />
quality B:<br />
160<br />
quality C:<br />
190<br />
scenario 1<br />
[m 3 /d)]<br />
used<br />
water:<br />
sum. 395<br />
greywater:<br />
150<br />
blackwater:<br />
110<br />
rest:<br />
135<br />
Figure 14: Demonstration for the water usage of one WUU<br />
desired<br />
water:<br />
sum. 385<br />
quality A:<br />
140<br />
quality B:<br />
110<br />
quality C:<br />
135<br />
scenario 2<br />
[m 3 /d)]<br />
used<br />
water:<br />
sum. 300<br />
greywater:<br />
120<br />
blackwater:<br />
80<br />
rest:<br />
100<br />
In the hierarchy, the water entity in higher levels comprises a number of water entities<br />
located in the inferior levels, and its water usage is determined by its affiliated water entities.<br />
The different water usage scenarios of different water entities can be combined unlimited. In<br />
order to simplify the calculation, the water usage scenarios of affiliated water entities retain<br />
the same as their superior water entity, e.g. the second water usage scenario of all affiliated<br />
water entities is summed as the second water usage scenario of their superior water entity. It<br />
only represents an extreme situation of reality, but all other combinations fall into the range