Chapter 3 Decision Support Model (IUWS-DSM) - Tubdok
Chapter 3 Decision Support Model (IUWS-DSM) - Tubdok
Chapter 3 Decision Support Model (IUWS-DSM) - Tubdok

Create successful ePaper yourself
Turn your PDF publications into a flip-book with our unique Google optimized e-Paper software.
<strong>Chapter</strong> 3 · <strong>Decision</strong> <strong>Support</strong> <strong>Model</strong> (<strong>IUWS</strong>-<strong>DSM</strong>) 77<br />
based only on pipe diameter and length. Thereby, the <strong>IUWS</strong>-<strong>DSM</strong> excludes the factor of<br />
population density, too.<br />
Pump stations are the essential parts of the conveying system, so the empirical cost<br />
functions are developed in general. Other ancillary works such as storages, valves and<br />
hydrants, etc., are often estimated approximately as the percentage of the pipe costs.<br />
Certainly, the costs of those ancillary works can be estimated by empirical cost function, as<br />
well (e.g. USEPA 1999 and Burnside 2005).<br />
The same methods are used to estimating O&M costs of conveying system, i.e. with cost<br />
functions or as percentage of construction cost. Oron (1996) states that annually O&M costs<br />
of distribution system are usually up to 3,0% of the overall capital investment over the lifetime<br />
of the asset, and Tang et al. (2006) calculated O&M costs of the water reuse system in Hong<br />
Kong to be 1,03% of the capital cost. The general O&M cost is thereby suggested as 2,0% of<br />
the capital cost (Chugg 2007).<br />
3.4.3 Energy assessment<br />
Nowadays the energy gains more and more attention worldwide. As an objective criterion,<br />
the assessment of energy consumption can help to compare not only different equipments<br />
and techniques, but also operational and management levels of water facilities between<br />
regions/countries. However, the research and information about the energy consumption in<br />
urban WIS are universally inadequate. So there are no existing simple tools to estimate the<br />
energy consumption in WIS. Against this background, a sketchy method for assess energy<br />
consumption is proposed.<br />
Energy Consumption in a Waterworks<br />
raw water pumping<br />
alum & polymer feed<br />
rapid mix<br />
flocculation<br />
clarification<br />
gravity filtration<br />
filtration media<br />
hydraulic surface wash<br />
backwash pumping<br />
in-plant pumping<br />
Cl2 feed<br />
clearwell storage<br />
finished water pumping<br />
admin. labor. mainten.<br />
0,6<br />
1,4<br />
0,3<br />
0,0<br />
0,3<br />
0,5<br />
0,4<br />
0,0<br />
4,7<br />
3,0<br />
2,1<br />
11,1<br />
8,6<br />
67,0<br />
0 10 20 30 40 50 60 70<br />
energy consumption (%)<br />
Energy Consumption in a WWTP<br />
influent pump station<br />
headworks<br />
1st clarifier & sldg.pmp.<br />
AS aeration<br />
2nd clarifier & RAS<br />
thickener & sldg.pmp.<br />
effluent filters<br />
process water<br />
solids dewatering<br />
heating<br />
lighting<br />
post-aeration / Cl2 mix<br />
0,4<br />
3,7<br />
1,6<br />
0,9<br />
4,5<br />
3,6<br />
2,2<br />
3,1<br />
7,0<br />
7,1<br />
10,3<br />
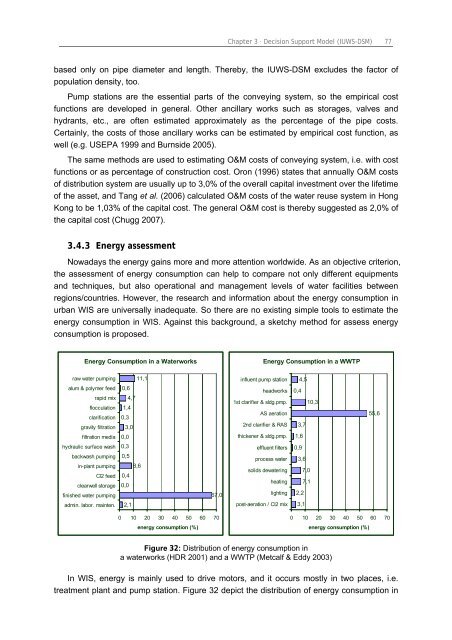
Figure 32: Distribution of energy consumption in<br />
a waterworks (HDR 2001) and a WWTP (Metcalf & Eddy 2003)<br />
55,6<br />
0 10 20 30 40 50 60 70<br />
energy consumption (%)<br />
In WIS, energy is mainly used to drive motors, and it occurs mostly in two places, i.e.<br />
treatment plant and pump station. Figure 32 depict the distribution of energy consumption in