Chapter 3 Decision Support Model (IUWS-DSM) - Tubdok
Chapter 3 Decision Support Model (IUWS-DSM) - Tubdok
Chapter 3 Decision Support Model (IUWS-DSM) - Tubdok

Create successful ePaper yourself
Turn your PDF publications into a flip-book with our unique Google optimized e-Paper software.
<strong>Chapter</strong> 3 · <strong>Decision</strong> <strong>Support</strong> <strong>Model</strong> (<strong>IUWS</strong>-<strong>DSM</strong>) 79<br />
The fourth part is sludge treatment, which can consume significant energy in treatment<br />
plants. Meantime, certain treatment processes can recover the energy, e.g. by anaerobic<br />
sludge digestion. Also, in some regions the sludge treatment is not the essential part in<br />
treatment plants. Thereby, sludge treatment is set up as an independent part.<br />
The fifth part is the auxiliary buildings. It stands as an individual part because of the<br />
building heating, which is related to the local climates. Heating system consumes<br />
significantly higher energy in cold area than in tropic area. It even can become the major<br />
energy consumption in treatment plants. In conveying system, pump stations are taken into<br />
account including booster pump station and lift satation.<br />
Assessment methods of energy consumption fall into two cases (Figure 33). Case 1 is<br />
especially for package plants, as all energy information is acquired from manufacturers.<br />
Case 2 is for rest of facilities. There are three methods to assess the energy consumption, i.e.<br />
1. based on the statistical data, 2. through the actual calculation, and 3. comparing to similar<br />
projects. In the <strong>IUWS</strong>-<strong>DSM</strong>, the unit measuring energy can be KWh/m 3 , KWh/capita, or<br />
KWh/day, whereby the model users choose the proper unit for their situation.<br />
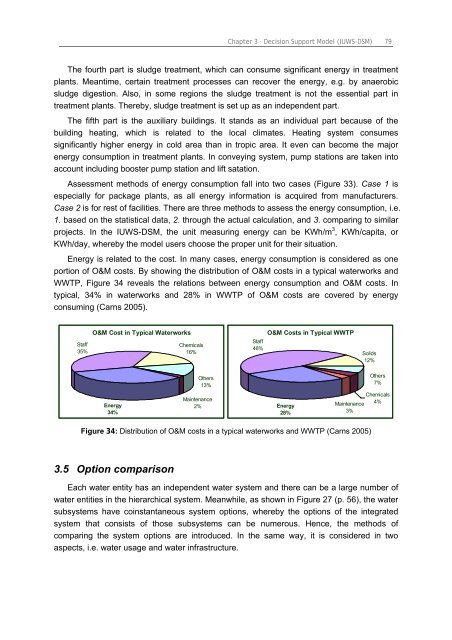
Energy is related to the cost. In many cases, energy consumption is considered as one<br />
portion of O&M costs. By showing the distribution of O&M costs in a typical waterworks and<br />
WWTP, Figure 34 reveals the relations between energy consumption and O&M costs. In<br />
typical, 34% in waterworks and 28% in WWTP of O&M costs are covered by energy<br />
consuming (Carns 2005).<br />
Staff<br />
35%<br />
O&M Cost in Typical Waterworks<br />
Energy<br />
34%<br />
Chemicals<br />
16%<br />
Others<br />
13%<br />
Maintenance<br />
2%<br />
O&M Costs in Typical WWTP<br />
Staff<br />
46%<br />
Energy<br />
28%<br />
Solids<br />
12%<br />
Others<br />
7%<br />
Chemicals<br />
4%<br />
Maintenance<br />
3%<br />
Figure 34: Distribution of O&M costs in a typical waterworks and WWTP (Carns 2005)<br />
3.5 Option comparison<br />
Each water entity has an independent water system and there can be a large number of<br />
water entities in the hierarchical system. Meanwhile, as shown in Figure 27 (p. 56), the water<br />
subsystems have coinstantaneous system options, whereby the options of the integrated<br />
system that consists of those subsystems can be numerous. Hence, the methods of<br />
comparing the system options are introduced. In the same way, it is considered in two<br />
aspects, i.e. water usage and water infrastructure.