Chapter 3 Decision Support Model (IUWS-DSM) - Tubdok
Chapter 3 Decision Support Model (IUWS-DSM) - Tubdok
Chapter 3 Decision Support Model (IUWS-DSM) - Tubdok

Create successful ePaper yourself
Turn your PDF publications into a flip-book with our unique Google optimized e-Paper software.
<strong>Chapter</strong> 3 · <strong>Decision</strong> <strong>Support</strong> <strong>Model</strong> (<strong>IUWS</strong>-<strong>DSM</strong>) 75<br />
Above all, all cost functions and sheets are country or region based. Unless two countries<br />
have very similar conditions, including economic, social and government aspects, the<br />
individual cost functions and sheets should be generated based on the local statistics.<br />
3.4.2.2 intake and treatment facilities<br />
Concerning the <strong>IUWS</strong>-<strong>DSM</strong>, as discussed in § 2.1.4.2, the treatment facilities of both raw<br />
water and sewage in are categorised into certain steps. The cost functions can therefore set<br />
up for each step. A blank sheet is set up in Table 31 as the pattern. If the cost functions are<br />
unavailable and the project data are inadequate, it is suggested to use the Stage2 of raw<br />
water treatment and Grade2 of used water as the base, where the costs of other steps are<br />
obtained by multiplying the coefficients with the base. Thereby, the relative costs can be<br />
obtained and compared.<br />
In order to more precisely represent the reality, certain ranges of system sizes are often<br />
established and each range has its specialised cost functions. Consulting USEPA (1979a)<br />
and USEPA (1979b), two levels are suggested and taken for the <strong>IUWS</strong>-<strong>DSM</strong> (Table 31).<br />
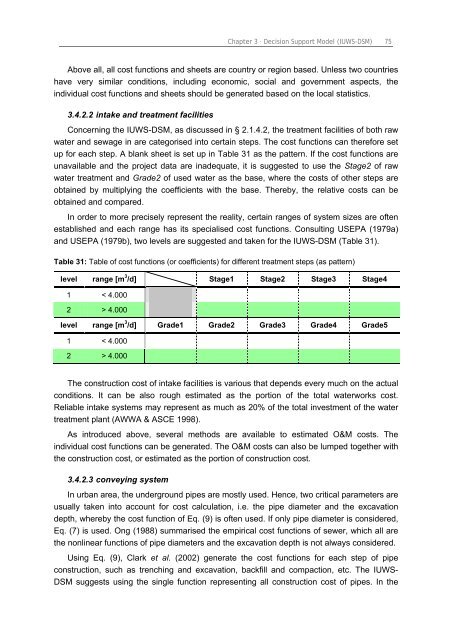
Table 31: Table of cost functions (or coefficients) for different treatment steps (as pattern)<br />
level range [m 3 /d] Stage1 Stage2 Stage3 Stage4<br />
1 < 4.000<br />
2 > 4.000<br />
level range [m 3 /d] Grade1 Grade2 Grade3 Grade4 Grade5<br />
1 < 4.000<br />
2 > 4.000<br />
The construction cost of intake facilities is various that depends every much on the actual<br />
conditions. It can be also rough estimated as the portion of the total waterworks cost.<br />
Reliable intake systems may represent as much as 20% of the total investment of the water<br />
treatment plant (AWWA & ASCE 1998).<br />
As introduced above, several methods are available to estimated O&M costs. The<br />
individual cost functions can be generated. The O&M costs can also be lumped together with<br />
the construction cost, or estimated as the portion of construction cost.<br />
3.4.2.3 conveying system<br />
In urban area, the underground pipes are mostly used. Hence, two critical parameters are<br />
usually taken into account for cost calculation, i.e. the pipe diameter and the excavation<br />
depth, whereby the cost function of Eq. (9) is often used. If only pipe diameter is considered,<br />
Eq. (7) is used. Ong (1988) summarised the empirical cost functions of sewer, which all are<br />
the nonlinear functions of pipe diameters and the excavation depth is not always considered.<br />
Using Eq. (9), Clark et al. (2002) generate the cost functions for each step of pipe<br />
construction, such as trenching and excavation, backfill and compaction, etc. The <strong>IUWS</strong>-<br />
<strong>DSM</strong> suggests using the single function representing all construction cost of pipes. In the