Chapter 3 Decision Support Model (IUWS-DSM) - Tubdok
Chapter 3 Decision Support Model (IUWS-DSM) - Tubdok
Chapter 3 Decision Support Model (IUWS-DSM) - Tubdok

You also want an ePaper? Increase the reach of your titles
YUMPU automatically turns print PDFs into web optimized ePapers that Google loves.
3.4 System evaluation<br />
<strong>Chapter</strong> 3 · <strong>Decision</strong> <strong>Support</strong> <strong>Model</strong> (<strong>IUWS</strong>-<strong>DSM</strong>) 71<br />
The cost and energy consumption are chosen as the criteria to evaluate system options,<br />
where the cost estimation is the essential criterion. The general methods to determine them<br />
are proposed. The model users choose the suitable criteria and methods according to their<br />
actual situation.<br />
3.4.1 System sizes<br />
As introduced in 2.1.2, the water infrastructure consists of intake and treatment facilities,<br />
and conveying system. Their sizes need be determined in the first.<br />
The sizes of intake and treatment facilities are directly corresponding to the water<br />
demand. The common metrical units are water volume (e.g. China, Australia) and capita<br />
equivalent (e.g. Germany). Usually the large treatment plants are on-site constructed, whose<br />
structures and facilities are concentrated. The package plants have even simpler situation as<br />
they are manufactured and generally have small sizes.<br />
Unlike intake and treatment facilities, the conveying system is spread over the whole<br />
service area. Hence, the determination of its scales is complex. In classical methods, it is<br />
calculated case by case based on the real data. In the early project phase, besides the<br />
difficulty of gathering the adequate actual data, the requirement of calculation accuracy is<br />
also relative low. Hence, the scales of conveying system, especially water networks and<br />
sewerage system, can be estimated based on statistical data, whereby certain relations<br />
between population and pipe system scales are established. One typical pattern is<br />
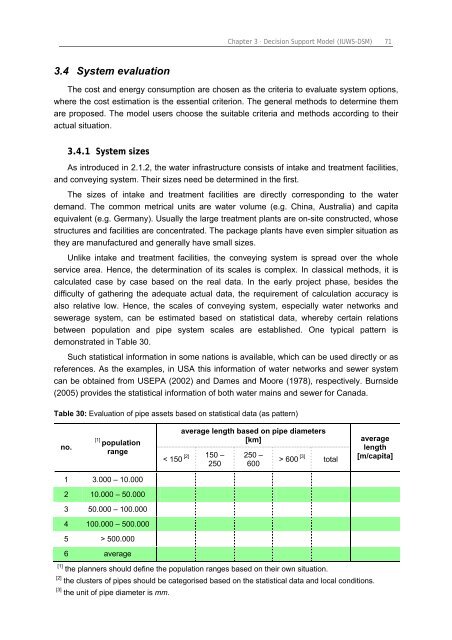
demonstrated in Table 30.<br />
Such statistical information in some nations is available, which can be used directly or as<br />
references. As the examples, in USA this information of water networks and sewer system<br />
can be obtained from USEPA (2002) and Dames and Moore (1978), respectively. Burnside<br />
(2005) provides the statistical information of both water mains and sewer for Canada.<br />
Table 30: Evaluation of pipe assets based on statistical data (as pattern)<br />
no.<br />
[1] population<br />
range<br />
1 3.000 – 10.000<br />
2 10.000 – 50.000<br />
3 50.000 – 100.000<br />
4 100.000 – 500.000<br />
5 > 500.000<br />
6 average<br />
< 150 [2]<br />
average length based on pipe diameters<br />
[km]<br />
150 –<br />
250<br />
250 –<br />
600<br />
> 600 [3] total<br />
[1] the planners should define the population ranges based on their own situation.<br />
[2] the clusters of pipes should be categorised based on the statistical data and local conditions.<br />
[3] the unit of pipe diameter is mm.<br />
average<br />
length<br />
[m/capita]